Unraveling Sitecore Search for Efficient Troubleshooting
Have you been setting up a source in Sitecore Search and had trouble determining what exactly went wrong? There’s a good chance, if you were like me, you were looking in the wrong location.
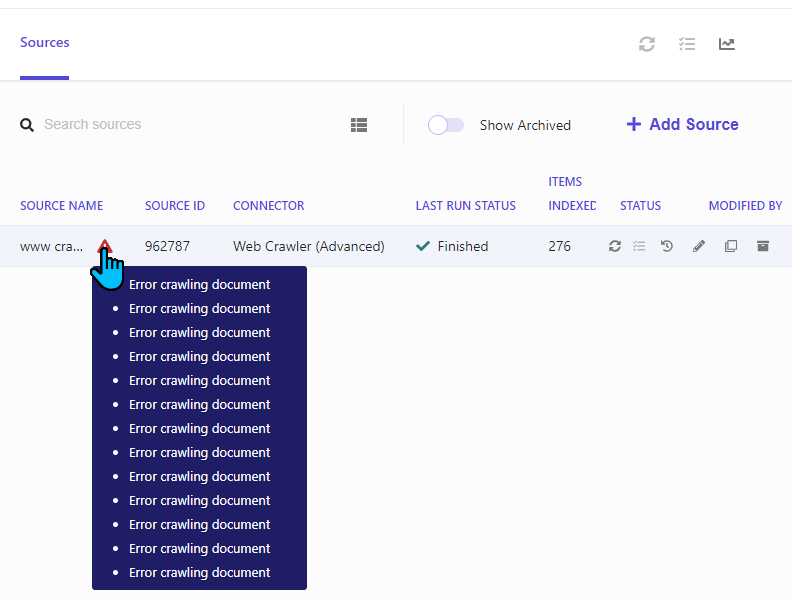
Seeing a bunch of errors that simply state Error crawling document endlessly listed can be a bit
daunting and confusing.
Navigate to Analytics Section
While within the Sitecore Search console, navigate to Analytics > Sources > Overview.
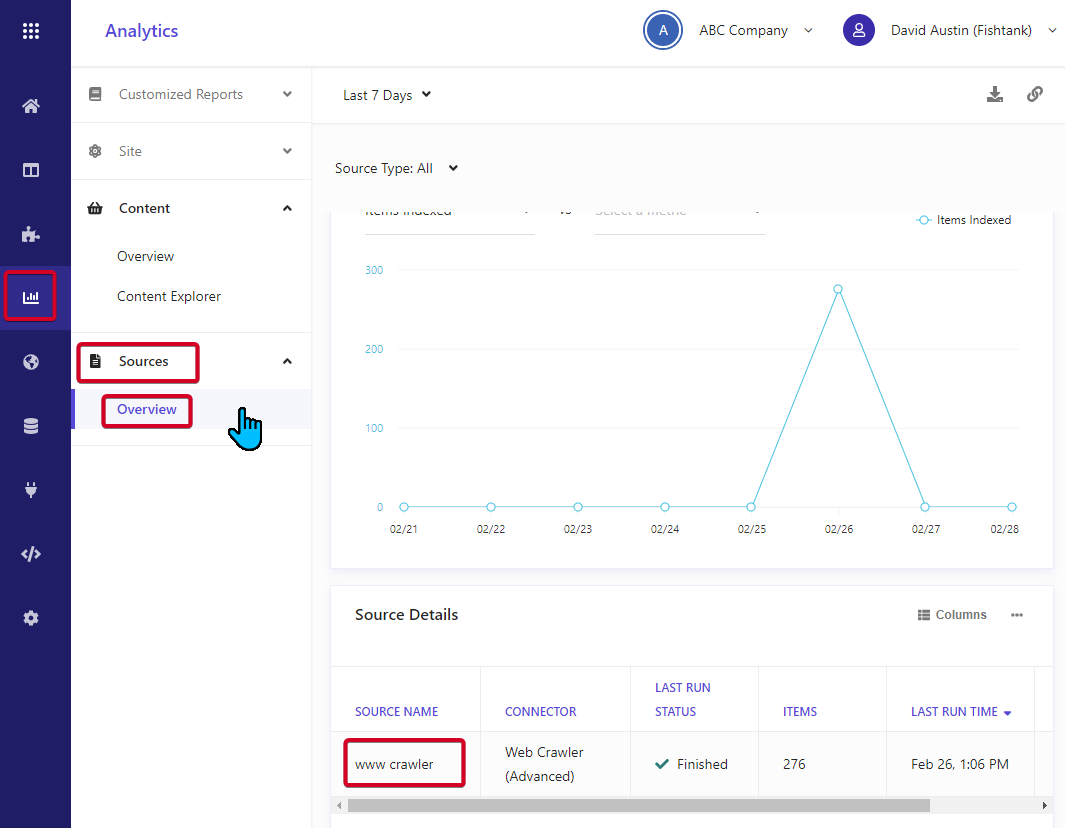
Once on the page, click on the source listed in the Source Details section. Once it loads you’ll be presented with a report on the last run of the source.
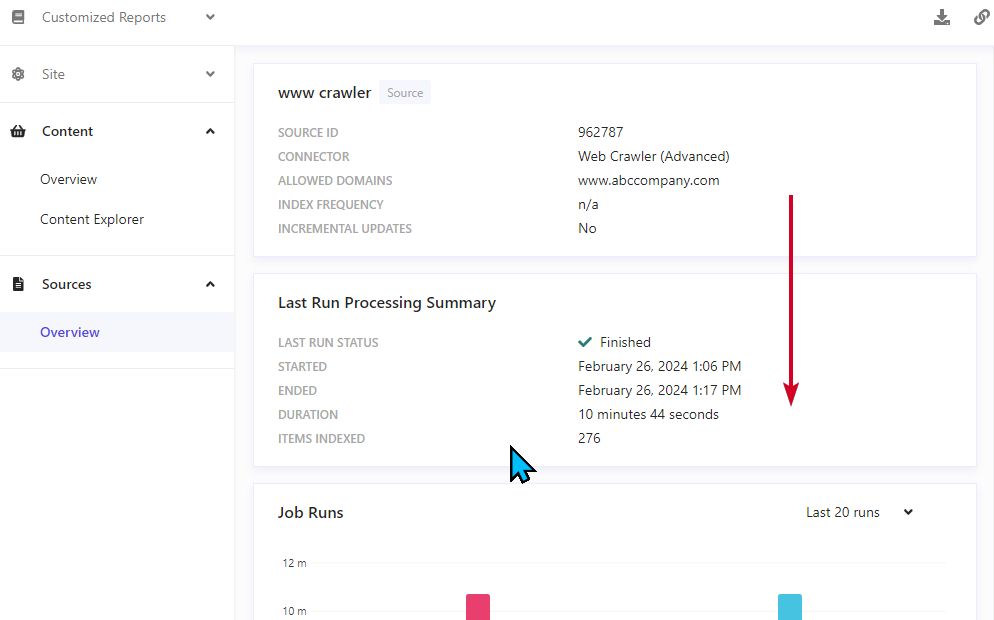
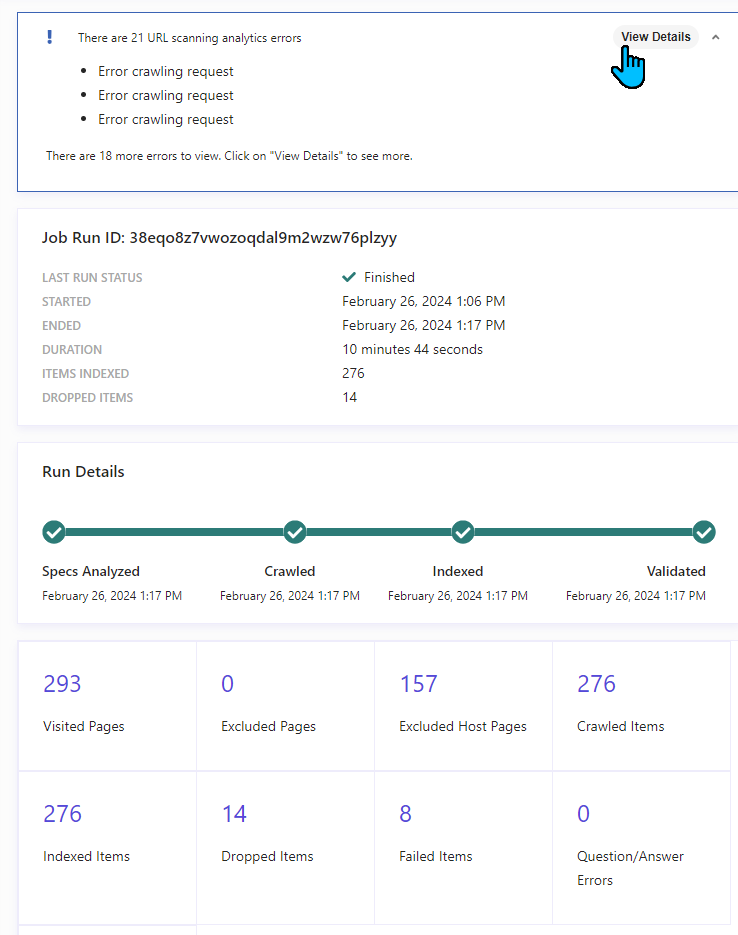
Scroll down until you see the Job Run List section and click on the last run indexing.
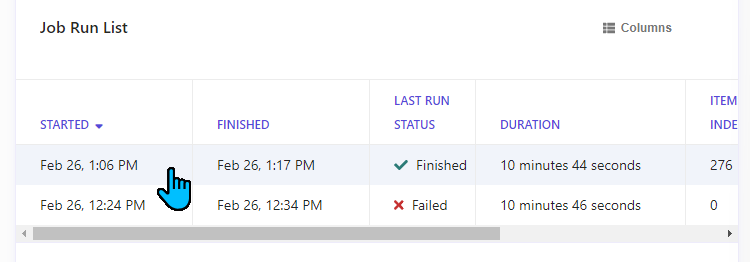
Once the report opens, you’ll have a few ways to view the failed items in your index.
Using View Details to View Issues
The first way is to use the View Details bar at the top of the report.
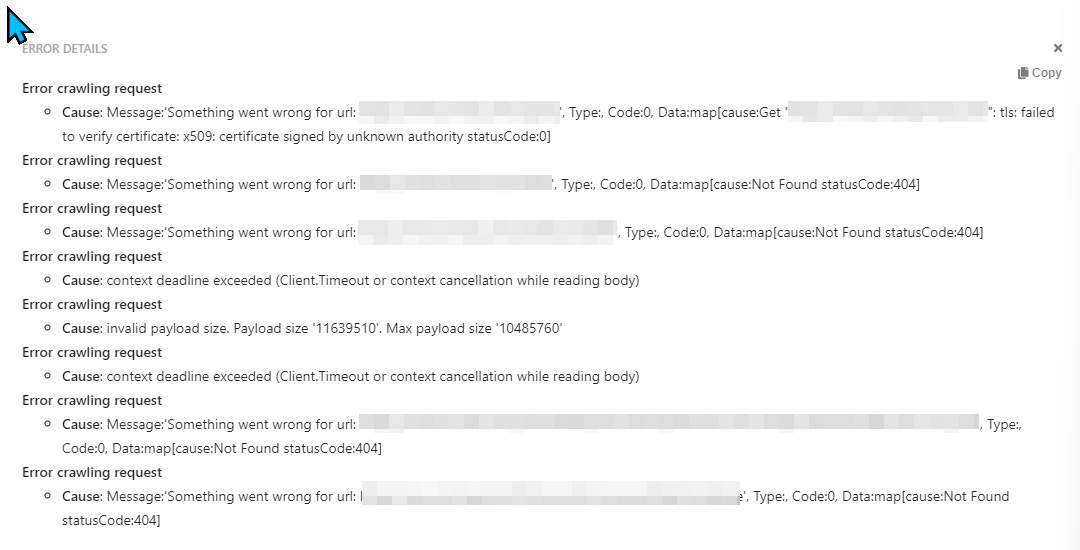
You can see upon clicking View Details a modal popup will show displaying a list of errors complete with
the urls with the errors and the issue on them. You can see below the wide variety of errors that are possible.
Using the URL Details Table at the Bottom of the Page
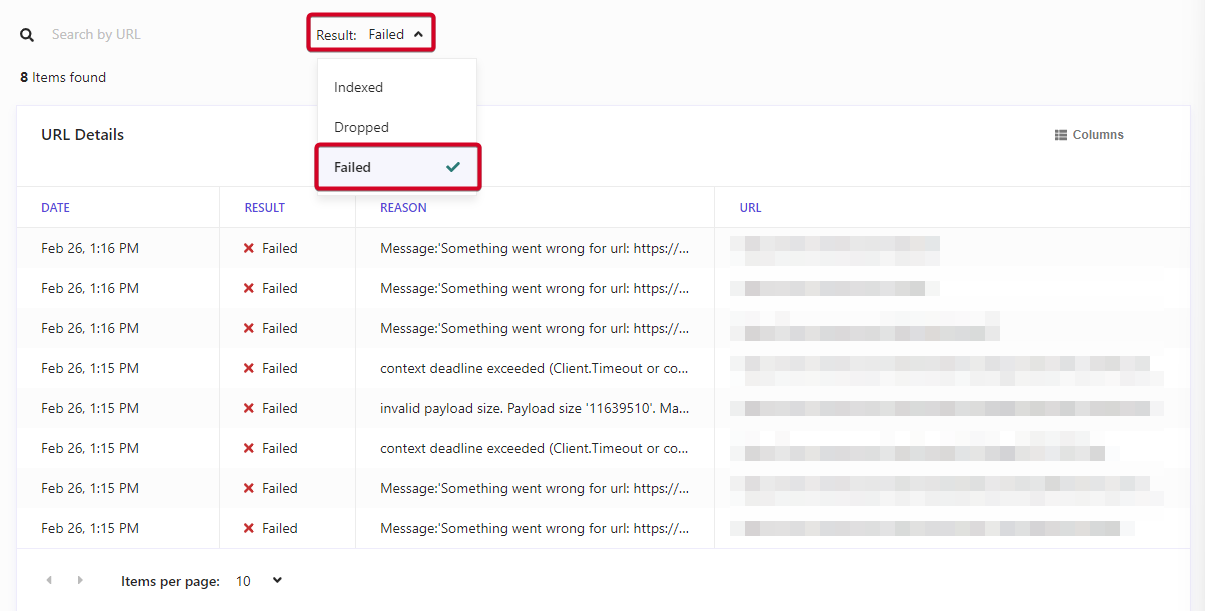
If you scroll down on the report, you’ll get a tabulated list of URLs, the result and reason for their failure. If
you use the Result filter, you can filter specifically by Failed.
Review
The types of errors you can get are varied and ultimately could depend on a number of factors which could include issues in the source configuration, but also on the site itself. These could be broken links, invalid SSL certs, bad redirects, etc.
Hopefully this makes it easy to debug something that initially seemed rather ominous.

Meet David Austin
Development Team Lead | Sitecore Technology MVP x 3
📷🕹️👪
David is a decorated Development Team Lead with Sitecore Technology MVP and Coveo MVP awards, as well as Sitecore CDP & Personalize Certified. He's worked in IT for 25 years; everything ranging from Developer to Business Analyst to Group Lead helping manage everything from Intranet and Internet sites to facility management and application support. David is a dedicated family man who loves to spend time with his girls. He's also an avid photographer and loves to explore new places.