The Value of Website Analytics and Page Performance
When you’re in the business of optimizing digital experiences for your customers, you need real-time insights into your site and page performance. Navigating the digital space requires insight, agility, and an keen understanding of visitor behaviour. For organizations moving to Sitecore XM Cloud, you might be wondering what your analytics options are. That’s where the Analyze function in Sitecore XM Cloud Pages comes in.
What is Sitecore XM Cloud Pages Analyze?
The Analyze function in Sitecore XM Cloud Pages provides real-time data and trend data over a specified period of time to help you make informed decisions and optimizations to your website. It’s a built-in site and page analytics tool that provides insight and visibility into your website performance, including the ability to track the impact of any changes you make. Analyze uses dynamic dashboards that update every minute, so you’re teams are equipped with the most recent data about your website’s performance.
Whether you need to know data about the entire website or analytics for specific pages, Analyze has you covered with its two key metrics: site insights and page insights.
Overview of XM Cloud Pages Site and Page Insights
Analyze in Sitecore XM Cloud Pages provides two main metrics to track and optimize your website experiences: Site Insights and Page Insights.
Site Insights
Site insights in the Sitecore XM Cloud Pages Analyze is a high-level view of your website’s performance. It allows you to track key metrics such as:
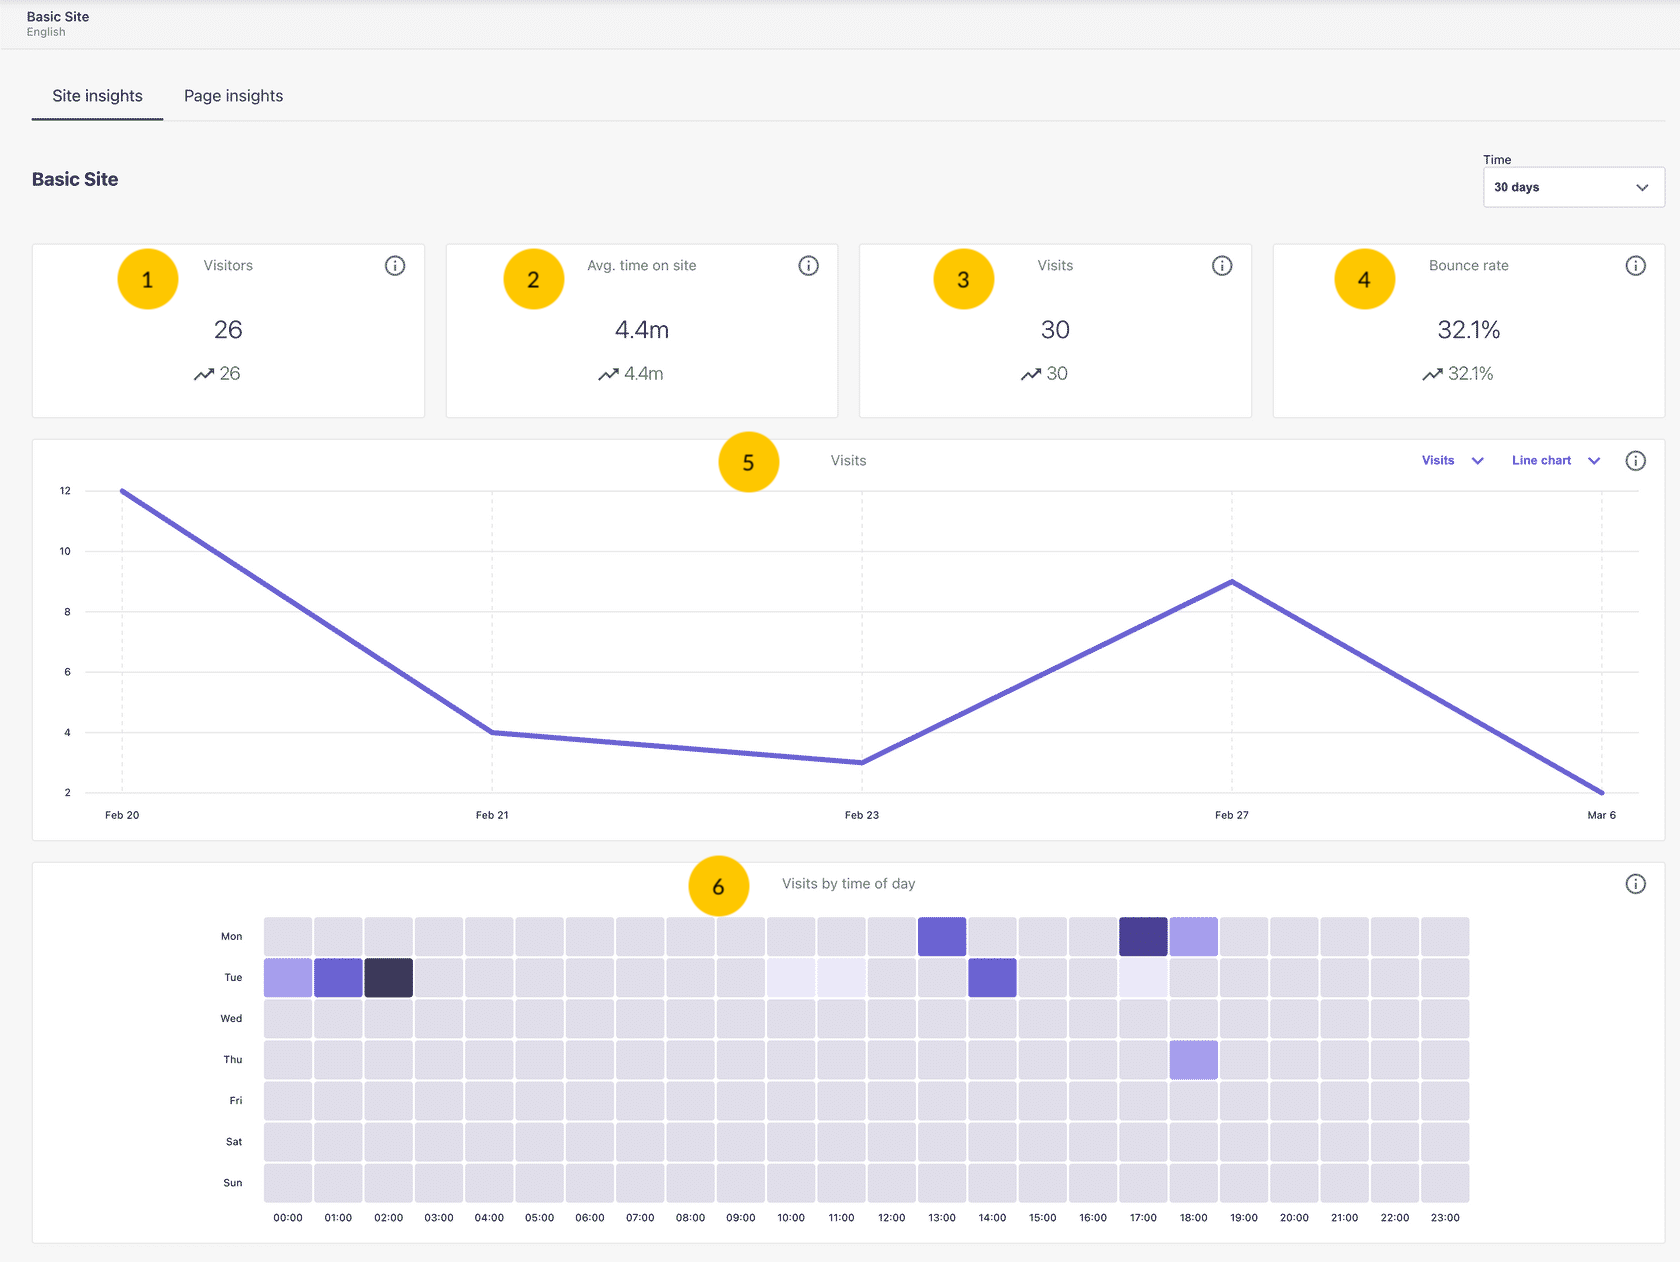
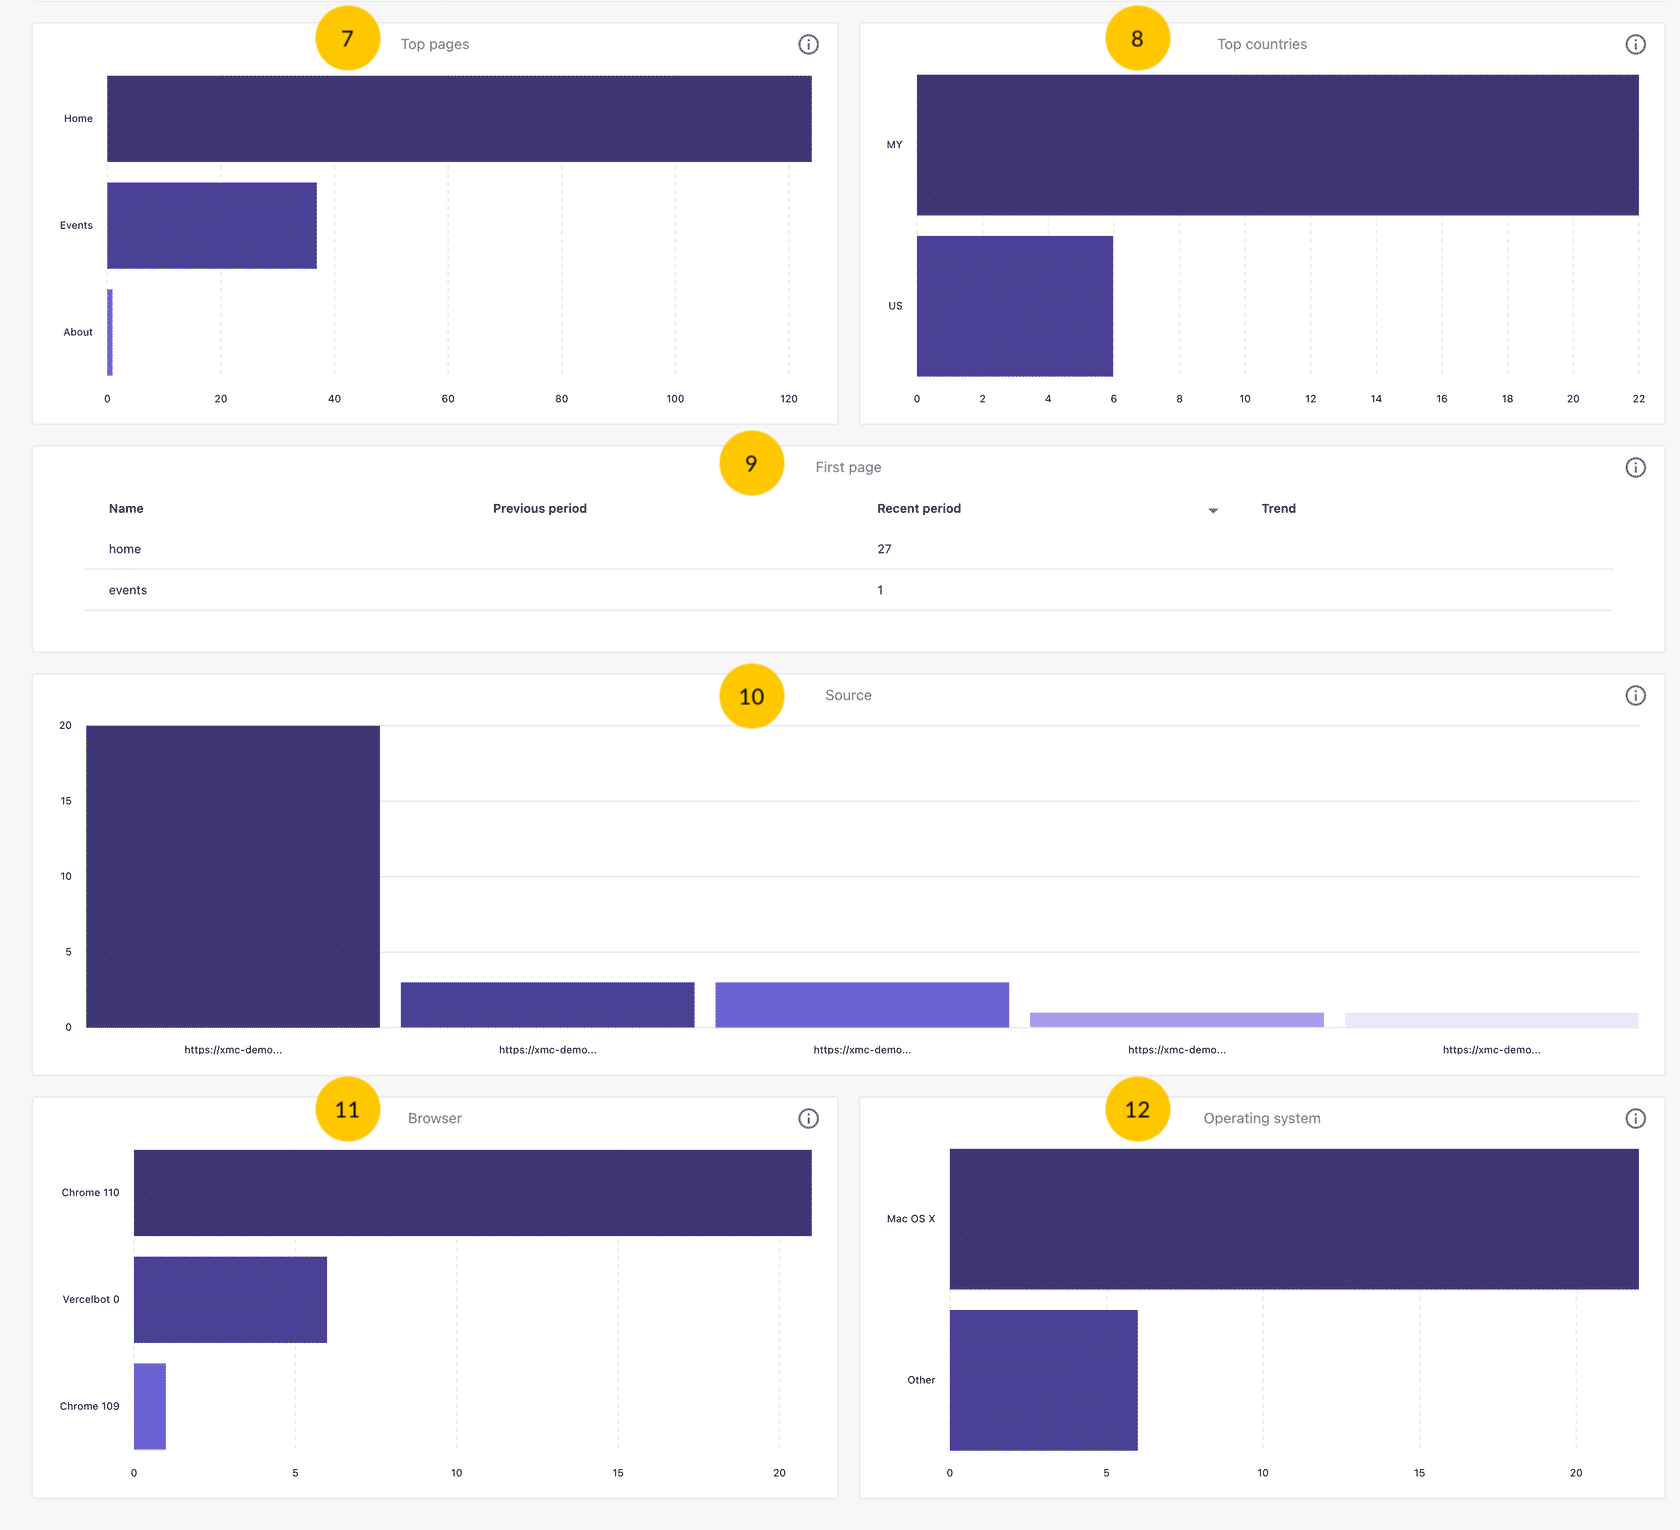
Figure 1: Screenshots of the analytics dashboard for site insights in the Analyze tool in XM Cloud Pages from Sitecore
| Site Insight Metric | Description |
|---|---|
| 1. Visitors | The number of distinct individuals who visited a website or page at least once within the given time frame. |
| 2. Average time on site | The average duration that visitors spent on the website or page, in minutes and seconds. |
| 3. Visits | The total number of active sessions on the website or page within the chosen time frame. A session includes all pages accessed and activities performed by a visitor from their entry to their departure from the site. Note — A visitor can make multiple visits to a website over a time period. |
| 4. Bounce rate | This metric indicates the percentage of visits to a website where the visitor only viewed one page, then left the website. |
| 5. Visit / Visitors Graphs | This line or column chart shows the count of active and closed visits/visitors that occurred on your website or page in the selected time period. There is the option to show a trend comparison of this count to the previous period. Note — Hover your mouse over the data points to view individual values. |
| 6. Visit by time of day | This metric illustrates the total number of visits that have ended (no longer active) on the website or page, segmented by hour and weekday. It's visualized as a heat map, with darker shades signifying a greater volume of visits. Note — Hover each square on the heat map to view their corresponding data. |
| 7. Top pages / Top Variants | This metric provides the names of the top ten pages or variants that received the most visits during the selected time period. Note — Hover the mouse over the bar to show the page visit value. |
| 8. Top countries | This metric shows the names of the top five countries from which visitors accessed the website or page. Note — Hover the mouse over the bar to show each value. |
| 9. First page | This metric delivers the names of the top five pages that initiated a visit, comparing data from both the current and previous periods, and highlighting the trend between these intervals. |
| 10. Source | The number of visits by the source of the traffic, which is derived from the referrer data. This metric helps you evaluate the traffic generated by your referrer or campaign. Note — Hover the mouse over the bar to show each source value. |
| 11. Browser | This metric shows the top five browser types that were used to access your website. Note — Hover your mouse over the bar to show each browser type value. |
| 12. Operating system | This metric displays the five most used operating systems for accessing your website. Note — Hover the mouse over the bar to show each operating system value. |
Page Insights
Page insights in Sitecore XM Cloud Pages Analyze provides a more detailed view of individual pages and page variants of the website. It allows you to track visitor interaction with each page and metrics such as:
- Page views
- Variant views
- Time on page per session
- Visitor information — i.e., types of devices, browsers used
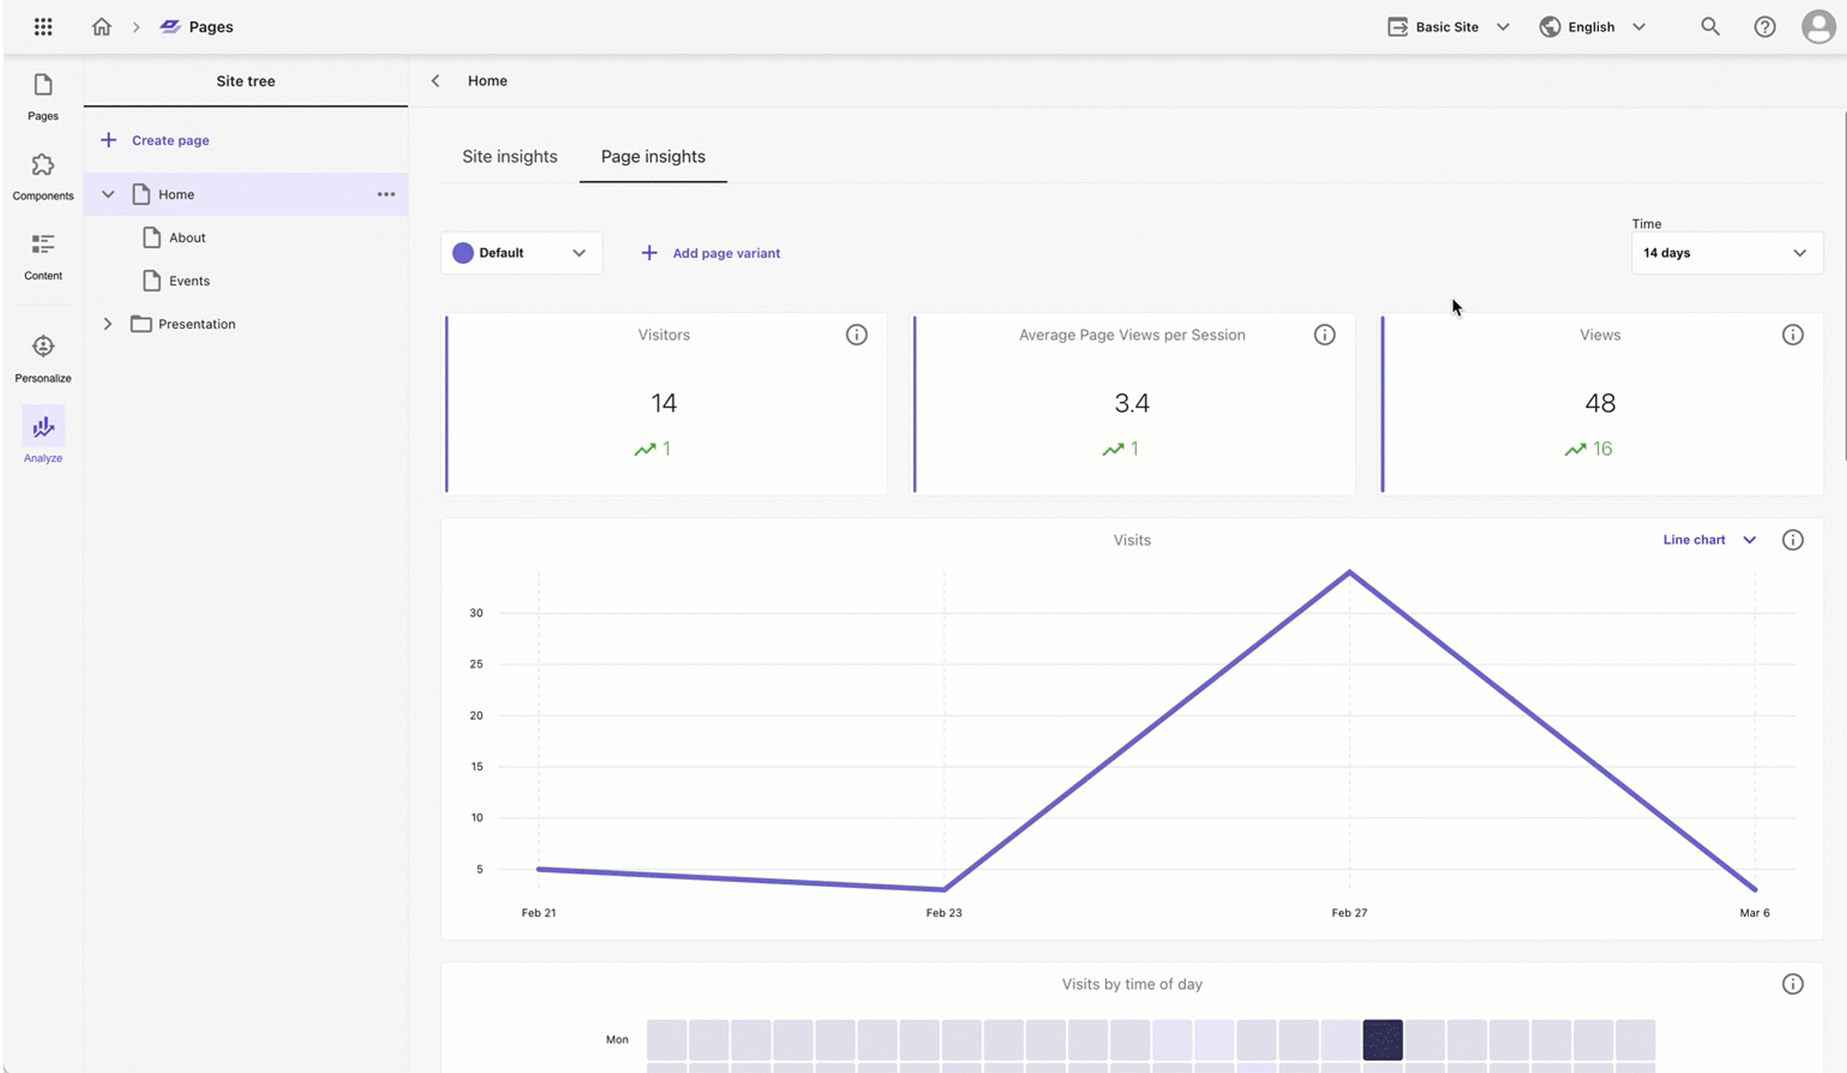
Figure 2: Screenshot of the analytics dashboard for page insights in the Analyze tool in XM Cloud Pages from Sitecore
All of this information can allow you to optimize your website experiences, page design, and content for specific devices.
Differences in Site Insights vs Page Insights
Here are a list key differences between the metrics in site insights versus page insights:
- Site insights provide "Average time on site" while page insights offer "Average page views per session".
- Page insights collect the "Variant views" metric in place of "Top pages" in site insights.
- Page insights do not offer the "Bounce rate" metric.
- Only Site insights capture the "First page" metric.
Another major distinction is that Page insights offer measurements for both the default page and its variants. Additionally, you have the capability to evaluate performance between the main page and its variants or even among different variants.
Using the Analyze Tool in XM Cloud Pages
To access the Analyze tool in Sitecore XM Cloud Pages, navigate to the Analyze tool on the left menu. Depending on which level of analytics you need, you can toggle between site insights and page insights at the top of the dashboard.
Set specific time periods for your analytics using the dropdown menu on the right side of the dashboard.
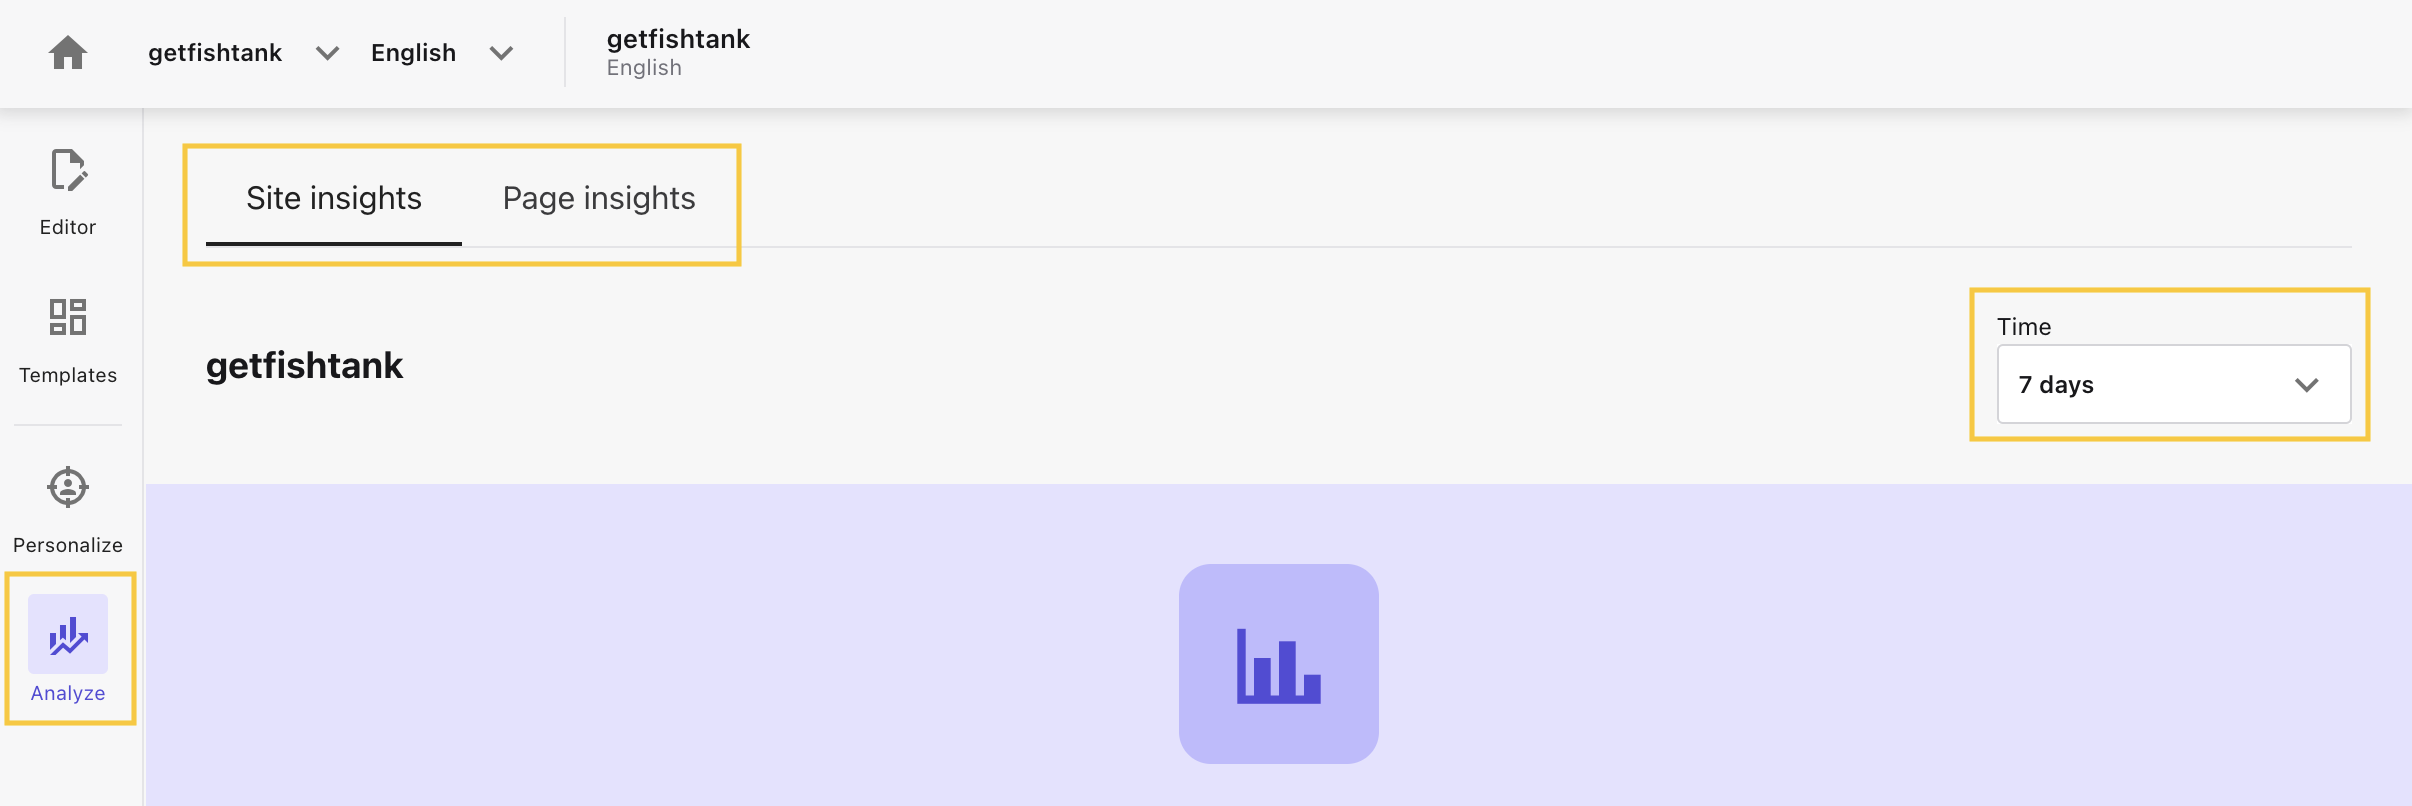
Figure 3: Screenshot of the Analyze tool in XM Cloud Pages showing the toggle between site and page insights and the time.
Using Analytics in Sitecore XM Cloud Pages
In today's digital age, understanding and leveraging the power of analytics is unavoidable. As we've delved into the Analyze tool in Sitecore XM Cloud Pages and its intricate features, it's clear that tools like these are paving the way for refined strategies, better user experiences, and more informed decision-making. Whether you're analyzing overarching site metrics or diving deep into page-specific insights, allow the Analyze tool to be your north star.
Remember that in the vast ocean of digital content, it's not just about sailing but navigating with precision. Embrace analytics, understand your audience, and steer your website towards uncharted successes.
Happy analyzing!

Meet Theresa Gutierrez
Sitecore Strategist | Sitecore Strategy MVP
⛳ 🌮👩🏻💻
Theresa, aka 'T', is a high-energy marketing creative with 8+ years of experience across various industries. She's passionate about delivering strategy and design, with a focus on Sitecore SaaS technologies. T is an avid golfer and loving dog momma, appeased only by delicious food and a bevy of something bubbly. Cheers!