Introduction to Dashboards in Sitecore CDP and Personalize
In using Sitecore CDP and Personalize, dashboards serve as an important tool for the review and analysis of various performance metrics. These dashboards allow for a comprehensive examination of:
- Customer types and the tracking of new customer acquisitions
- Order-related metrics — such as items purchased and total order values
- Changes in customer segments
- Trends in inbound traffic
Another helpful feature includes the capability to identify and categorize suspected bot activities, along with pinpointing their peak times of occurrence, ensuring a more robust understanding of all interactions within the platform.
You can access the Sitecore CDP and Personalize dashboards by clicking Dashboards in the top navigation menu.
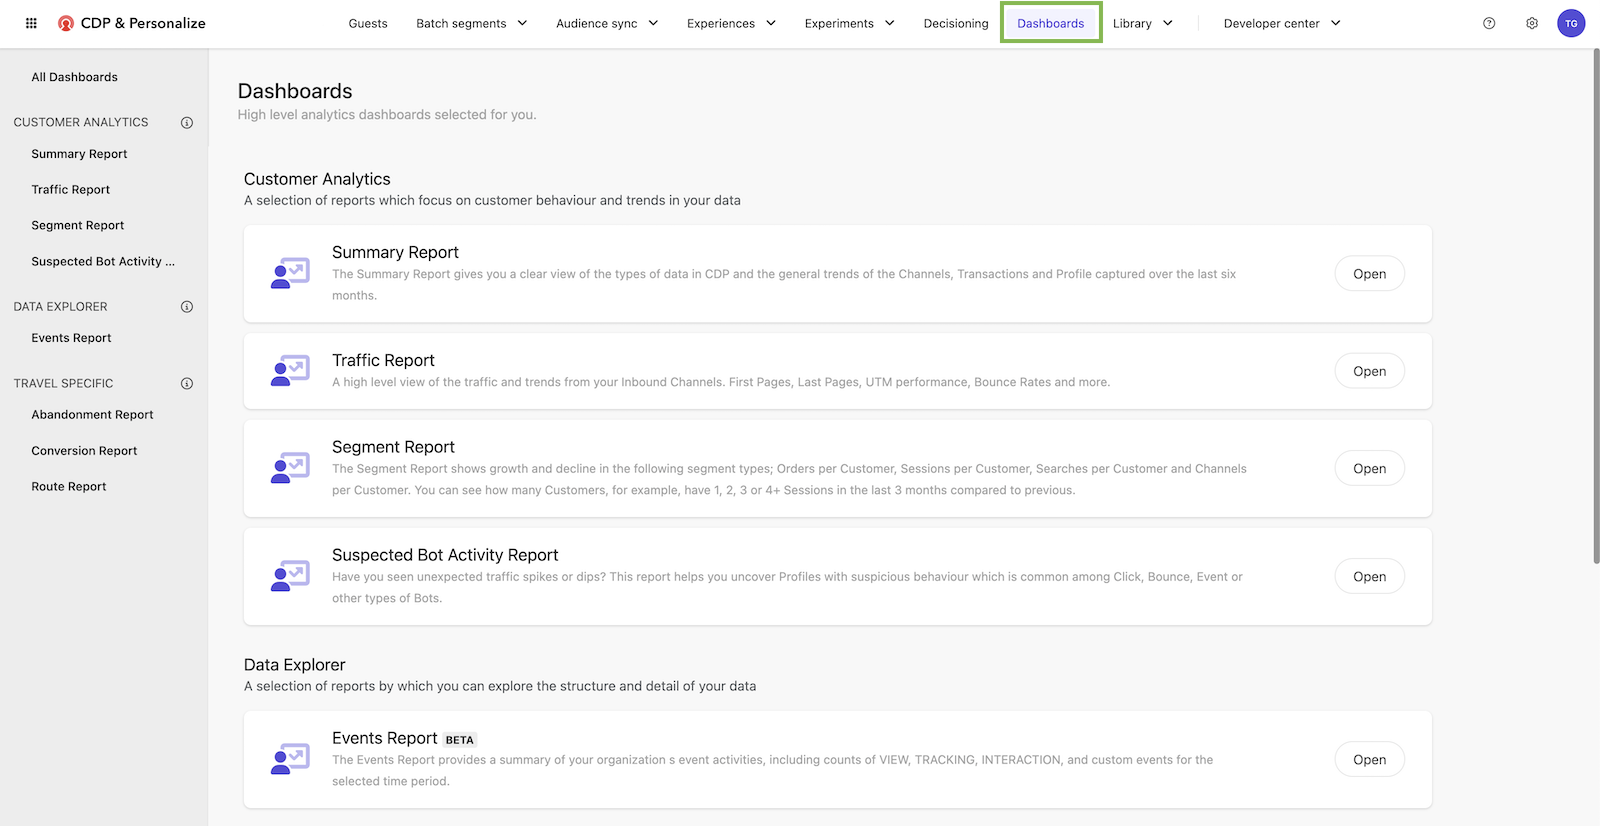
Figure 1: Screenshot of Dashboards in Sitecore CDP and Personalize
Please note — Due to the SaaS nature of Sitecore CDP and Personalize, the screenshots provided in this blog may differ slightly from the latest version of the platform, as continuous updates and enhancements are part of its evolving nature.
TLDR — Overview of Sitecore CDP Reports
At the time this blog was written, there were eight different reports available. I’ve outlined them briefly here in this table. However, the Travel Specific reports are only offered to clients within the Travel industry.
| Sitecore CDP and Personalize Reports | Quick Overview |
|---|---|
| Summary Report | Get a snapshot of data types, channel trends, transaction details, and profile changes over the past six months. |
| Traffic Report | Explore high-level insights into inbound channel traffic, including landing and exit pages, UTM efficacy, and bounce rates. |
| Segment Report | Analyze segment growth and decline across orders, sessions, searches, and channels, with comparative data over recent months. |
| Suspected Bot Activity | Identify unusual traffic patterns and spot potential bot activities impacting your site's performance. |
| Events Report (BETA) | Summarize your organization's events, tracking views, interactions, and custom events in a selected timeframe. |
| Abandonment Report | Uncover insights into abandoned online sessions, exploring potential customer interests and UTM correlations. |
| Conversion Report | Gain an understanding of successful online conversions, analyzing customer profiles and possible UTM links. |
| Route Report | Examine specific travel routes with a focus on key performance indicators (KPIs). |
Sitecore CDP and Personalize Report Filters
Make the most of the reports in Sitecore CDP and Personalize by applying filters to tailor the dashboard to your needs. You also can download a detailed CSV report for deeper analysis. Whether it's understanding guest behaviour or distilling down order details, this feature will help you with making data-driven decisions.
Each report offers the ability to tailor your view with easy-to-use filters to focus on specific time frames and channels. The default setting showcases data from the last six months with no specific point-of-sale channel selected. Filter by the following parameters:
Time— The default timeframe is six months, but you can select from a specific date range by day or yearBy— Choose your data's resolution to view trends over days, weeks, or monthsChannel— Focus on specific channels like email or web, or view all by defaultPoint of Sale— Narrow down to particular points of sale, or view all by defaultDownload— Easily download your report as a ZIP containing CSV files with the Download icon.

Figure 2: Screenshot of the filters tool in Sitecore CDP and Personalize reports
The Sitecore CDP Summary Report
Discover key trends and actionable insights with the Summary Report dashboard in Sitecore CDP and Personalize. It's your go-to tool for understanding seasonal patterns, evaluating the impact of your marketing campaigns, and sparking new ideas for customer experiences and experiments. The Summary Report is updated every 24 hours, ensuring you always have the most recent data available.
The Summary Report includes the following reports:
- Guest types
- New visitors and customers
- Order items
- Order items (value)
- Inbound channels
- Outbound channels
- Session types
- Cart proportion %
- Other items
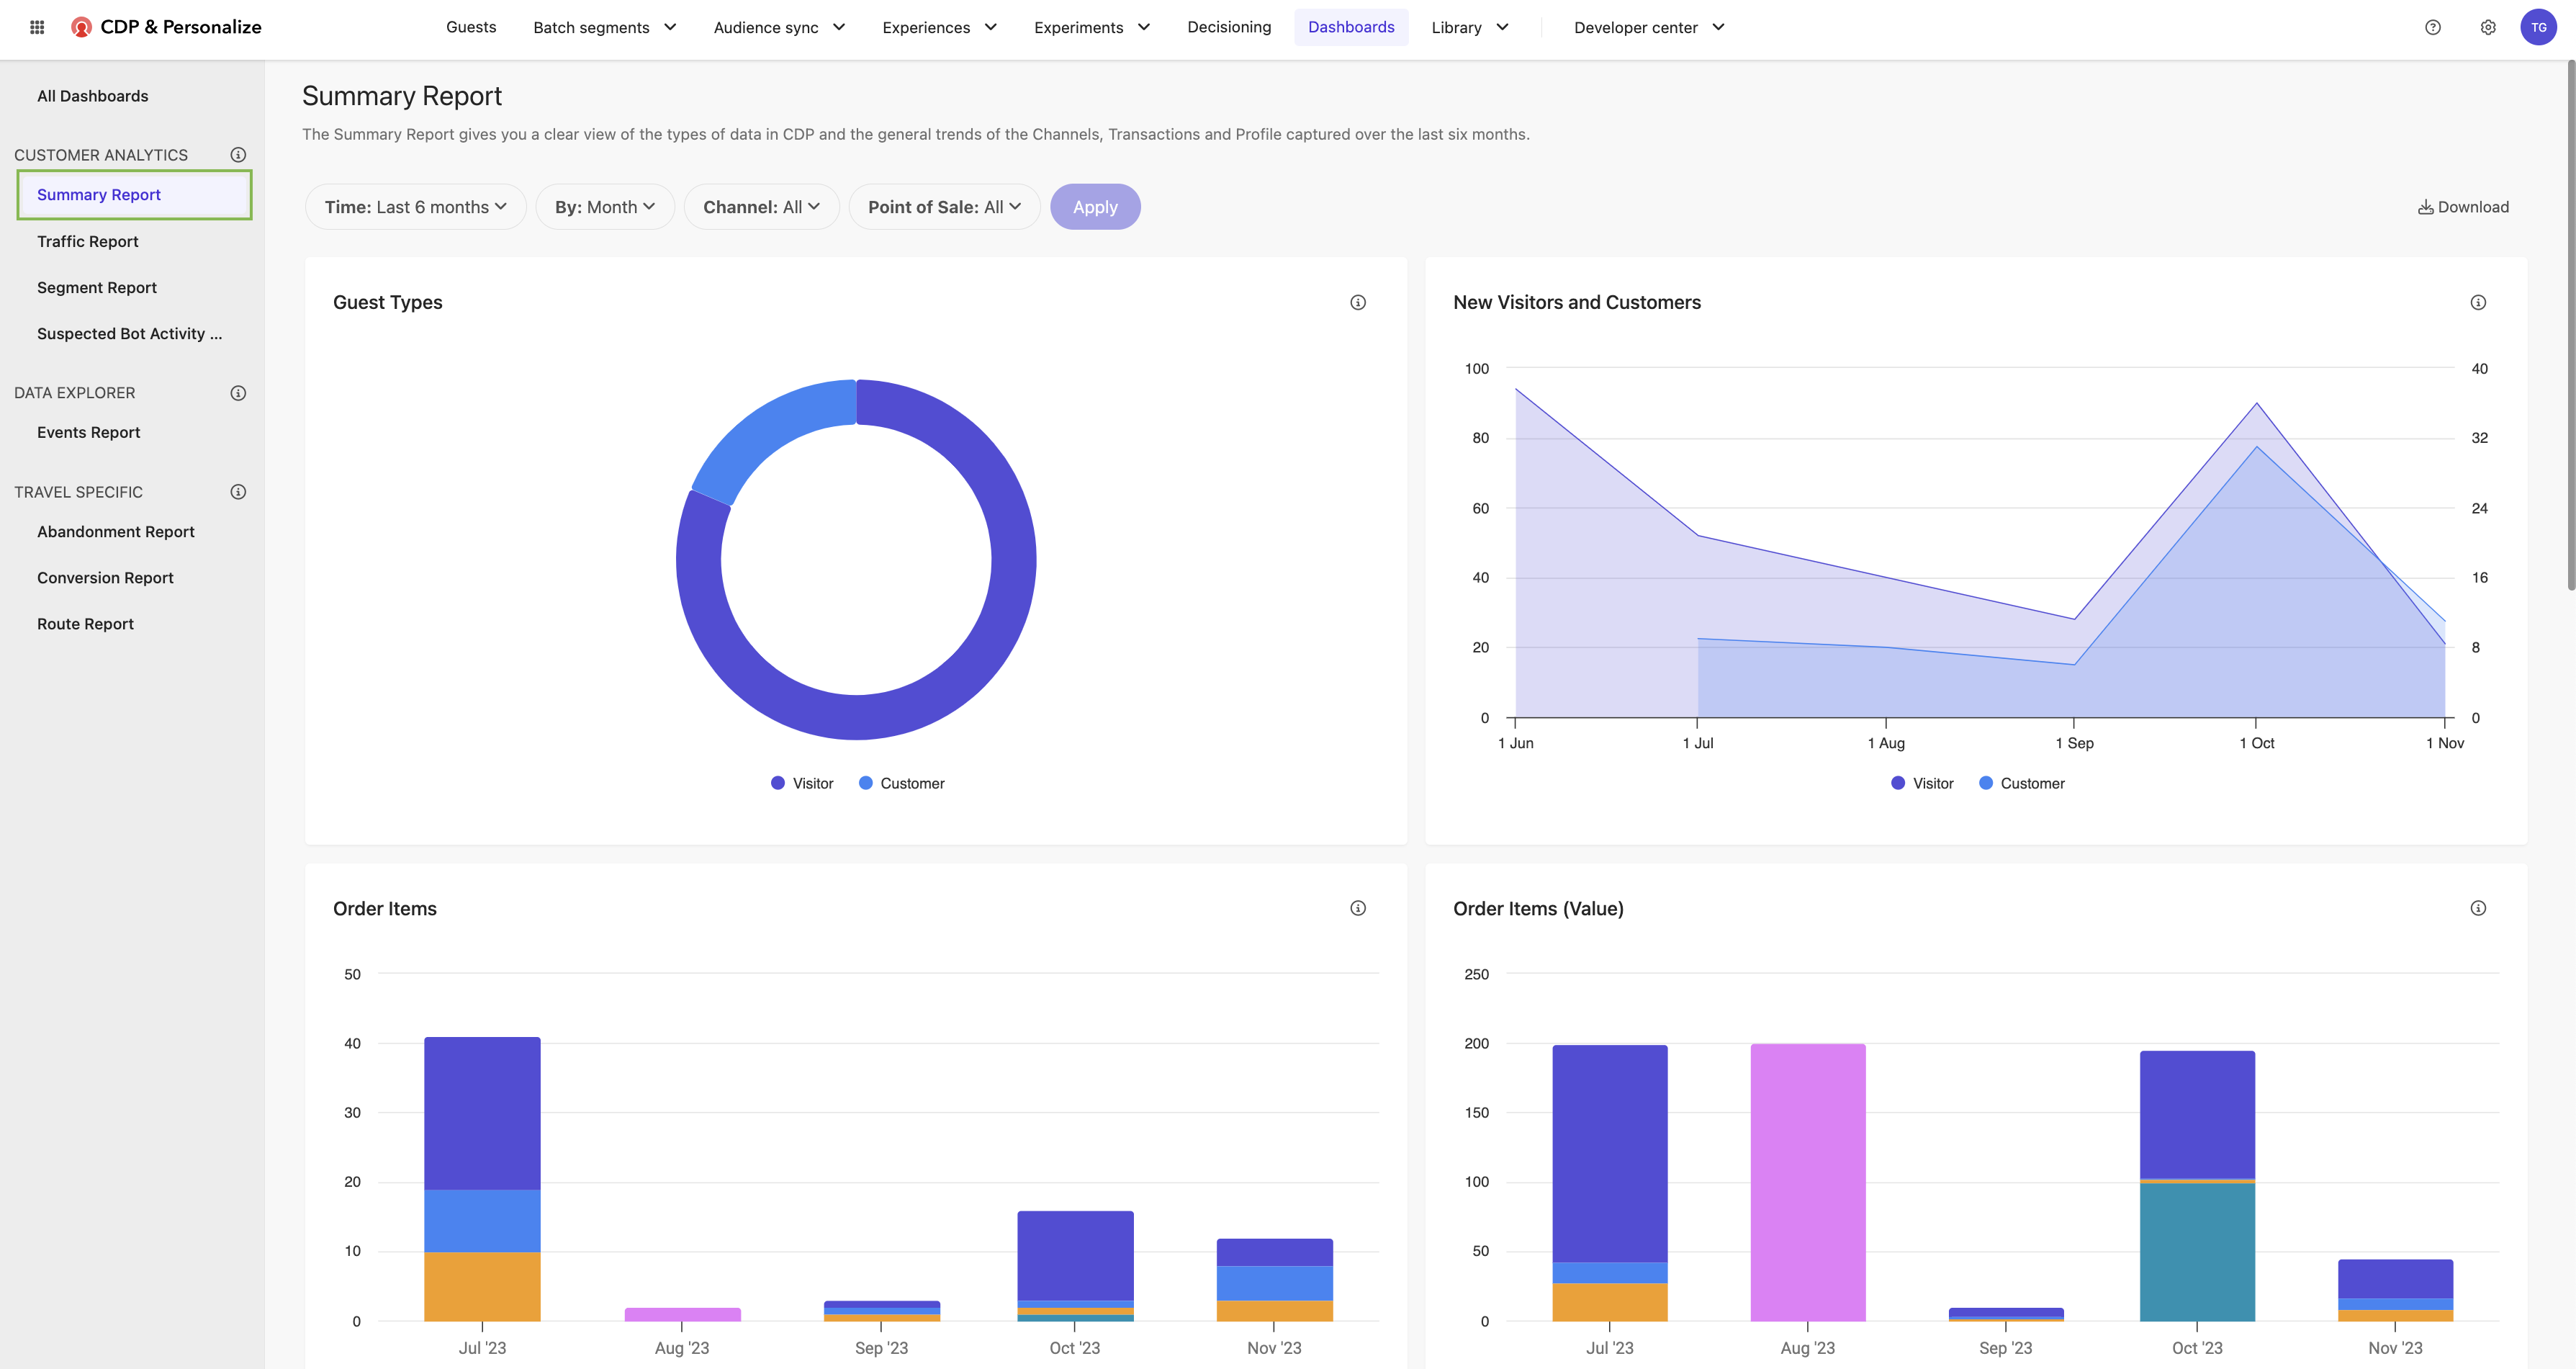
Figure 3: Screenshot of the Summary Report Dashboard in Sitecore CDP and Personalize
Guest Reports
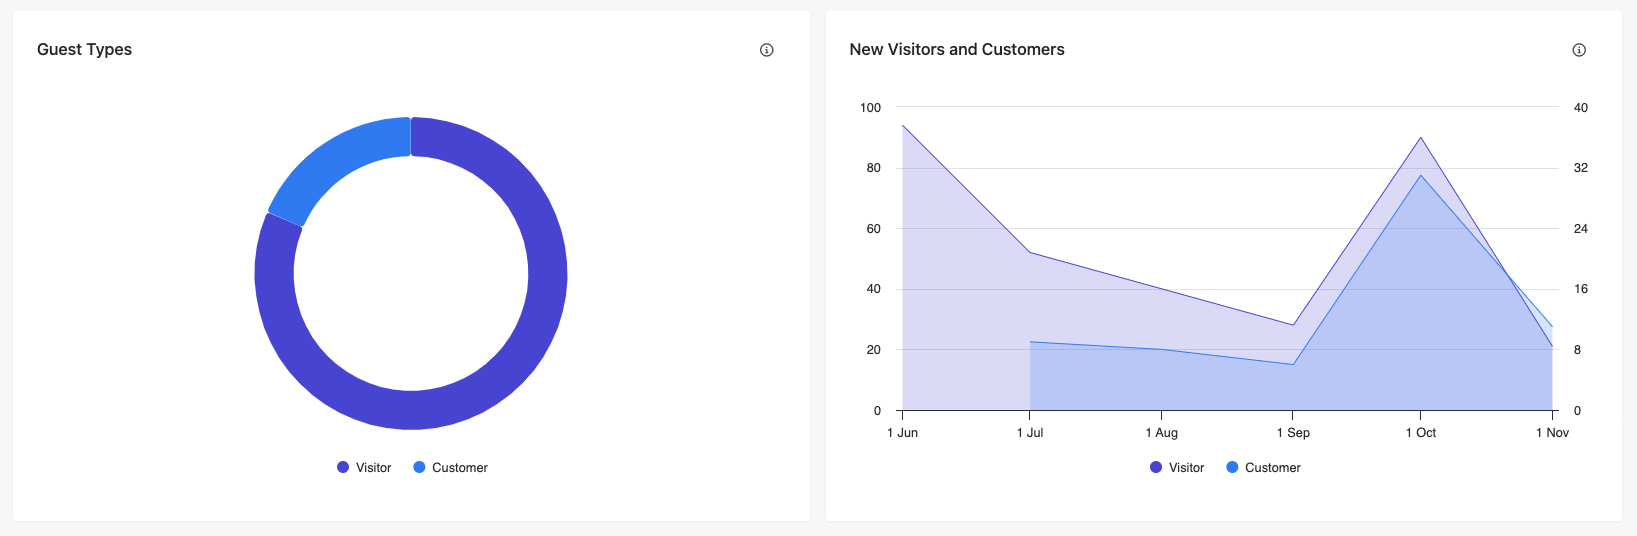
Figure 4: Screenshot of the Guest Types and New Visitors and Customers reports in Sitecore CDP and Personalize’s Summary Report Dashboard
Guest Types Report: Easily understand your website traffic by exploring the ratio of different guest types – customers, visitors, and possibly travellers (where applicable) – during your selected timeframe. Simply hover over a section of the guest type graph to see the exact number of each type.
New Visitors and Customers Report: Discover the influx of new visitors and customers on your website within your chosen period. 'New visitors' are those first identified in the selected timeframe, while 'new customers' are profiles newly converted and recognized as customers. Just hover over a data point for detailed numbers.
Order Reports
In the Summary Report dashboard, the order reports section provides a detailed view of transaction data and related specifics for your chosen time period.
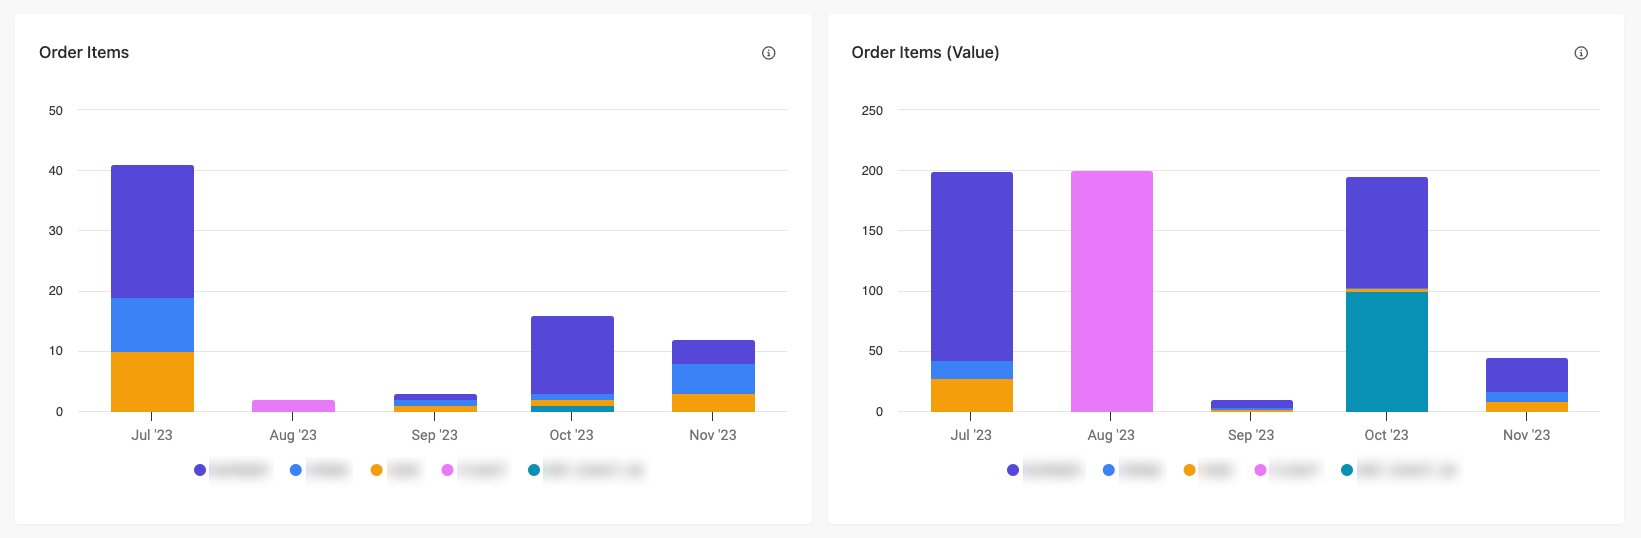
Figure 5: Screenshot of the Order Items and Order Items (Value) reports in the Summary Report Dashboard in Sitecore CDP and Personalize
Order Items Report: Explore product performance with the Order Items report, detailing the breakdown of different item types sold in your selected period. Note that 'other items' are covered in a separate report. The data tallies each item type's sales figures for easy comparison. For a closer look at specific numbers, hover over the segments in the bar chart to reveal detailed counts. Customize your view by clicking on an item type in the legend to toggle its visibility on the graph.
Order Items (Value) Report: Provides an insightful look into the relative monetary value of different order items throughout your chosen time frame. It achieves this by aggregating the total values per item type. For specifics on each item's value, simply hover over a segment in the bar chart to view a detailed callout. You can also click on any item type in the legend to filter it out from the graph, tailoring the chart to your focus.
Other Items Report: For those utilizing the 'other items' classification, this report provides a detailed analysis of these unique order items during your specified period. It compiles the data by tallying the count of each 'other' item type. Get precise numbers for each category by hovering over their respective segments in the graph, where a pop-up will reveal detailed information. Additionally, you can click on any item type in the legend to filter that category out of the graph, customizing the display to your preference.
Session Type Reports
Session Type reports offer insights into various user session types and channels within your chosen time frame. On the Summary Report dashboard, these reports serve as a snapshot of site traffic trends. For deeper analysis, delve into the traffic and segment reports. To view detailed values for each data point, simply hover over them in the graphs.
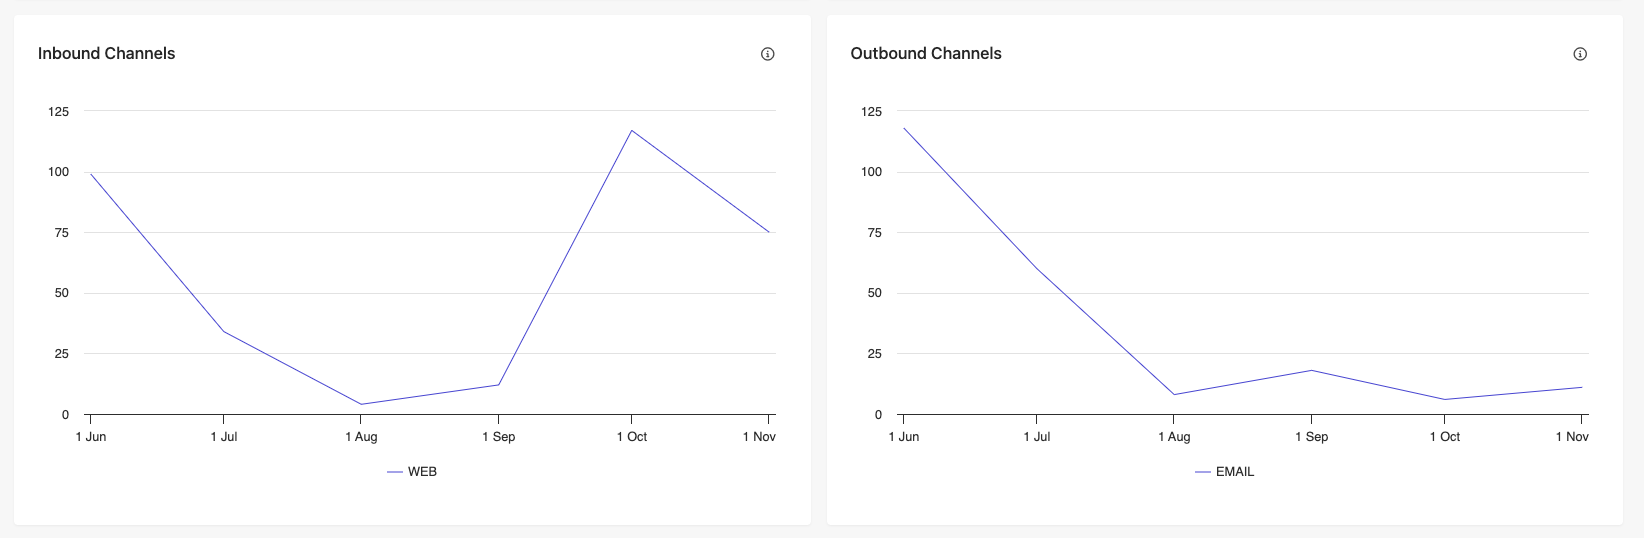
Figure 6: Screenshot of the Inbound Channel and Outbound Channel reports in the Summary Report Dashboard in Sitecore CDP and Personalize
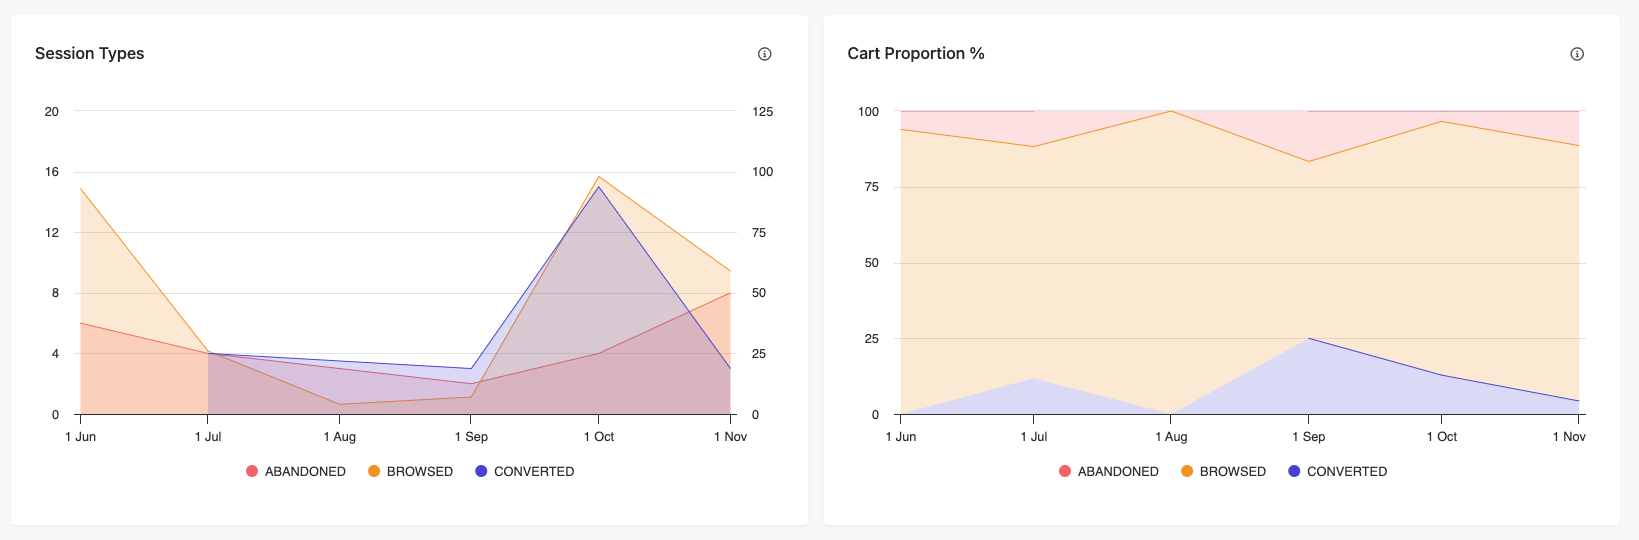
Figure 7: Screenshot of the Guest Types and New Visitors and Customers reports in the Summary Report Dashboard in Sitecore CDP and Personalize
Inbound and Outbound Channel Reports: Discover trends in user engagement through our intuitive graphs. Track inbound sessions across different channels like web or mobile, and outbound activities such as email triggers or audience syncs. These are neatly summed up for daily, weekly, or monthly periods. Hover over any point for detailed info.
Session Types Reports: Dive into the dynamics of various session types – abandoned, where carts were filled but not checked out; browsed, where users explored without adding to the cart; and converted, where browsing led to transactions. This data is smartly aggregated for your selected timeframe.
Cart Proportion % Report: Get a clear, proportional view of session types - converted, abandoned, or browsed - over your chosen period. Our graph elegantly illustrates the distribution, offering a snapshot of customer behaviour at a glance. Interact with the graph legend to focus on specific session types.
The Traffic Report
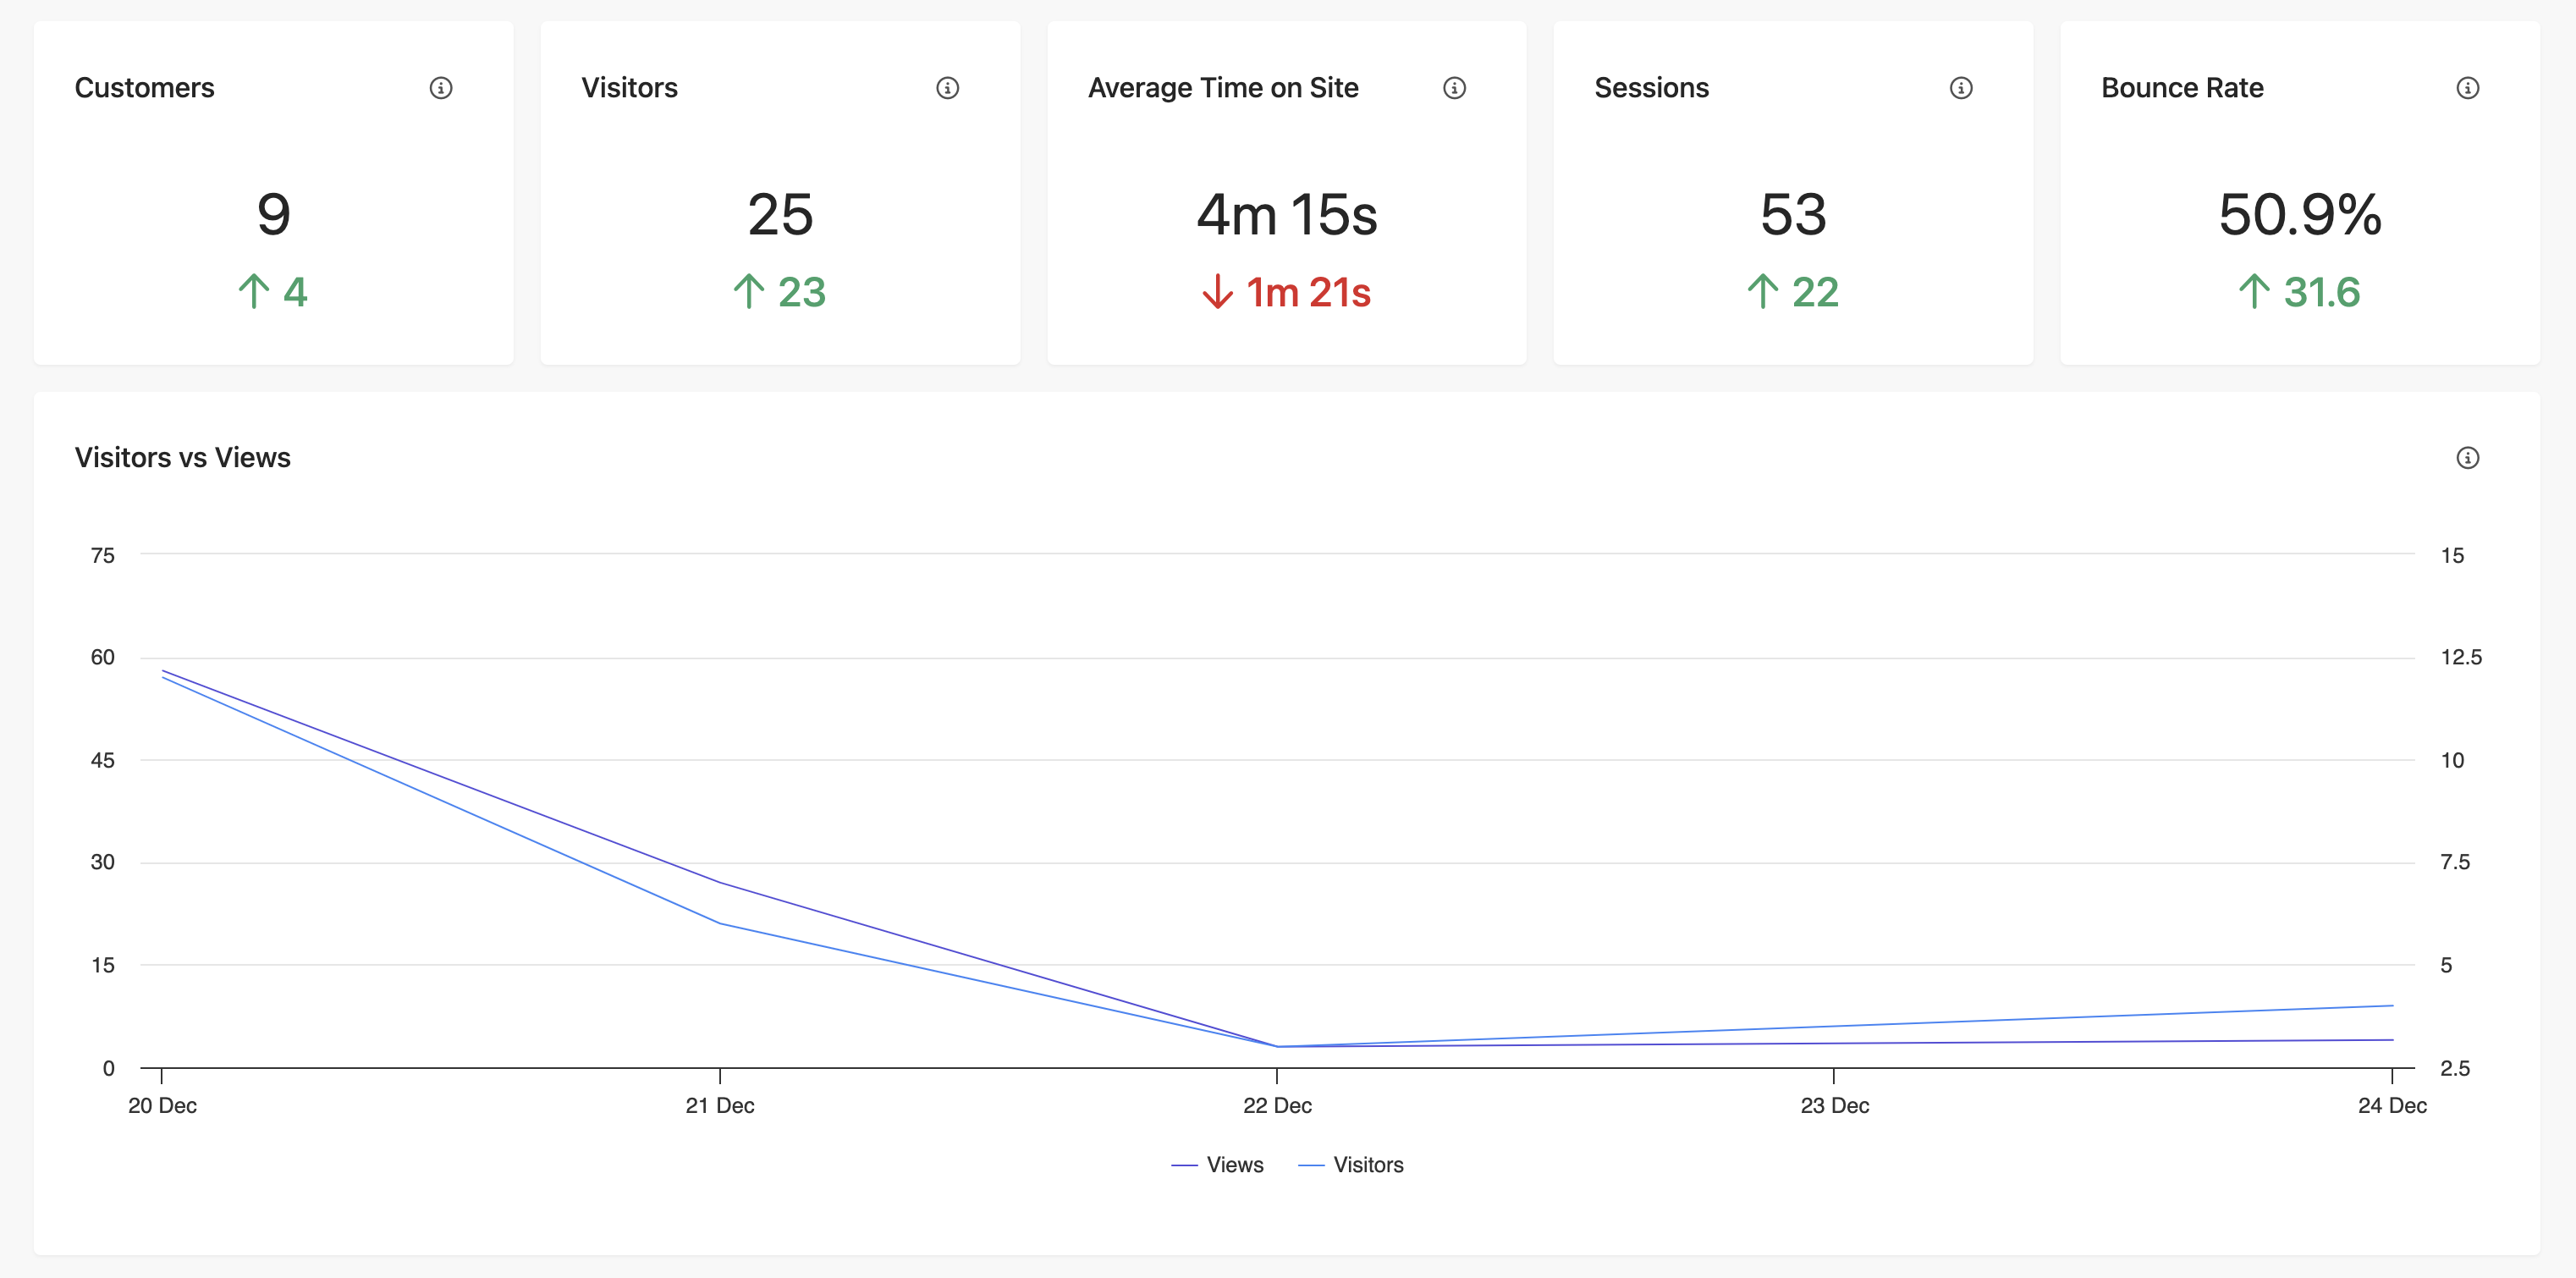
Figure 8: Screenshot of the Guest Types and New Visitors and Customers reports in the Summary Report Dashboard in Sitecore CDP and Personalize
Session Traffic Reports: Gain insights into your site's traffic trends with reports that compare the most recent complete week to the preceding one. Each report features a color-coded arrow indicator next to the numbers: a green upward arrow signifies an increase in traffic, while a red downward arrow indicates a decrease, offering a quick, visual comparison between the two weeks.
- Customers: Counts the guests identified as 'Customers' who visited your site in the last week.
- Visitors: Tracks the number of 'Visitor' type guests on your site in the previous week.
- Average Time on Site: Displays the mean duration of visits in minutes and seconds (mm:ss) across the last week.
- Sessions: Totals up the number of sessions, determined by view events, for the past week.
- Bounce Rate: Calculates the percentage of single-page sessions against the total sessions in the last week, indicating visitors who left without further browsing.
Visitors vs Views: This chart compares visitor count and view counts over the last complete week. The scale for views is positioned on the left, while the scale for visitors is on the right side of the chart. To focus on specific data, click on either 'Visitors' or 'Views' in the graph legend to toggle their visibility. For detailed information on any point, simply hover over it.
If there's a noticeable gap between the two graphs, it could be a sign of bot activity. Check out the suspected bot activity report for a more in-depth investigation.
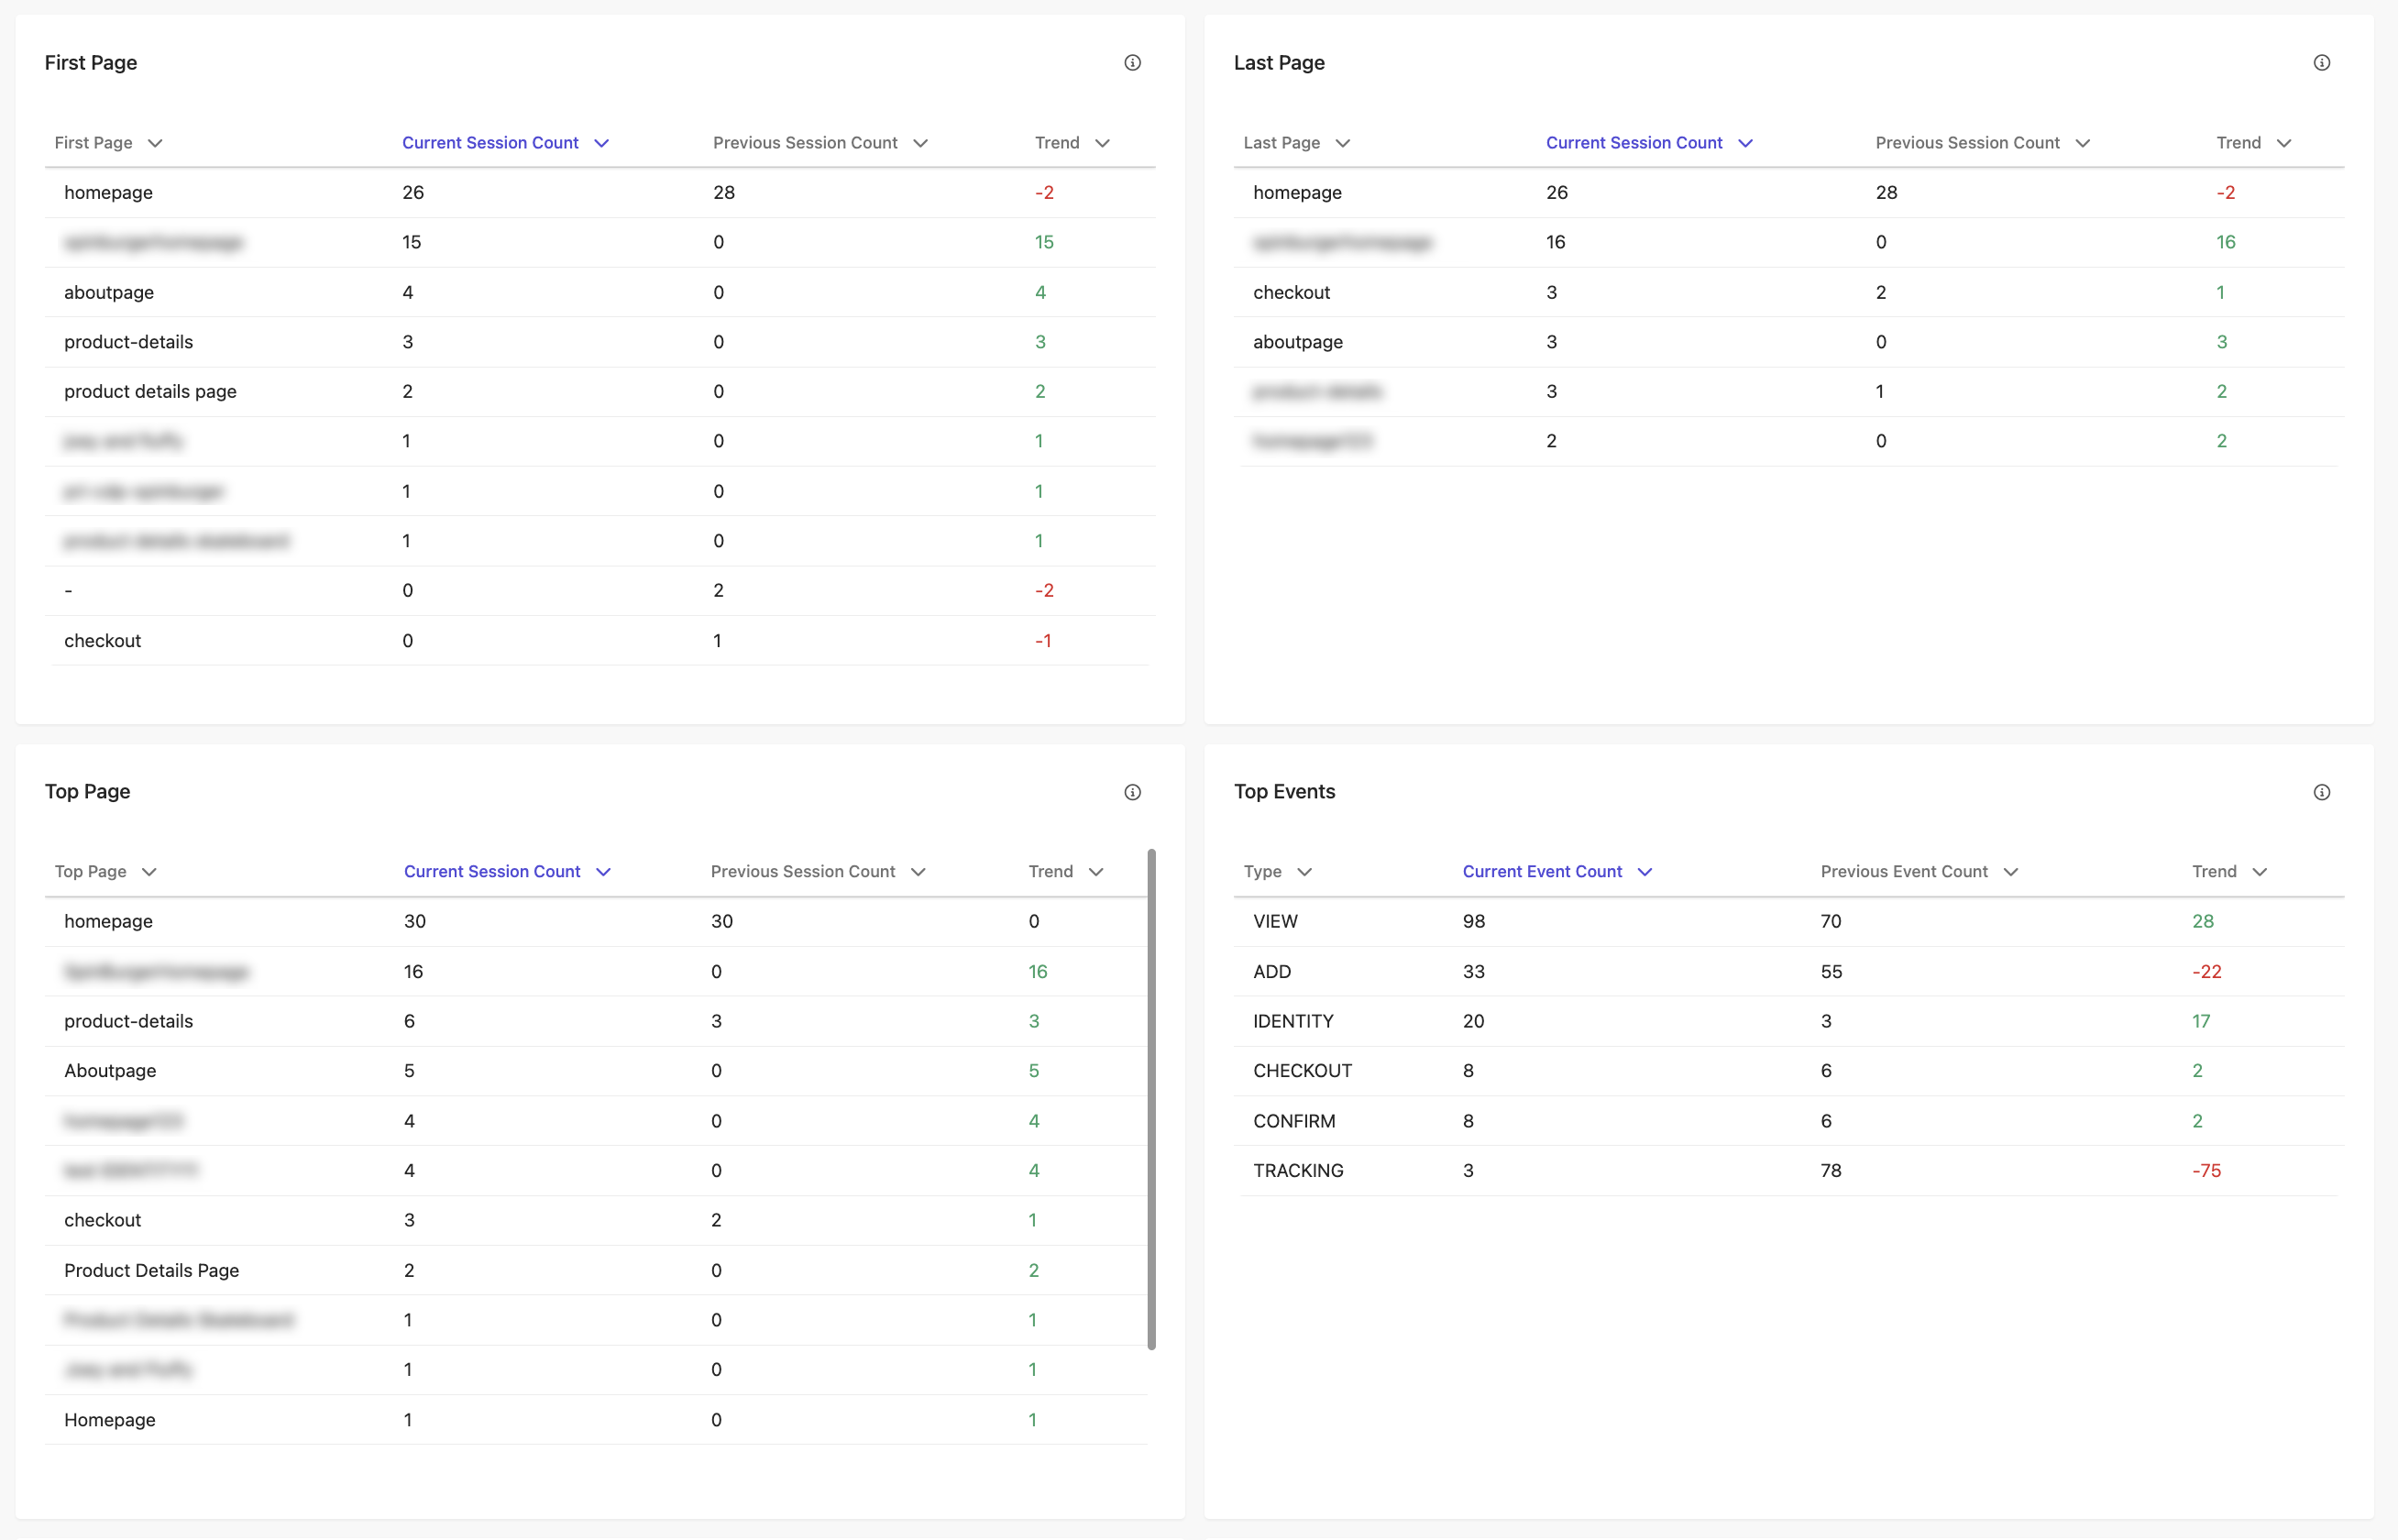
Figure 9: Screenshot of the Guest Types and New Visitors and Customers reports in the Summary Report Dashboard in Sitecore CDP and Personalize
First Page Report: Dive into the top ten initial page visits from the past week, where 'first page' refers to the very first page accessed in each unique session. The accompanying graph compares figures from the last complete week with those from the week prior, highlighting the variance under 'Trending Sessions'.
Last Page Report: Get an overview of the top ten final pages viewed on your site during the last complete week. Here, the 'last page' is the final page a user visits in a unique session. The graph compares the final page visit counts from the past week with those from the previous week, highlighting the variances in 'Trending Sessions'.
Top Page Report: Discover the ten pages that garnered the most visits in the last complete week. The graph outlines visit counts from the past week and compares them with the week before, detailing the changes in 'Trending Sessions'.
Top Events Report: Explore the ten most prominent events from the last complete week, ranked by the count of unique sessions featuring each event. The accompanying graph displays event frequencies for the recent week, compares them with the week prior, and outlines the fluctuations in 'Trending Events'.
Discover Site Dynamics with the Traffic Report Dashboard: Uncover the latest in site traffic and visitor behaviour, including initial landing pages and most visited pages. For those utilizing Urchin Traffic Monitors (UTMs), delve into detailed UTM metrics. This report covers a complete week, from Monday to Sunday, offering a concise yet comprehensive view.
Updated daily, you can fine-tune your analysis by selecting specific time frames, channels, or points of sale using the Traffic Report's filter. By default, it presents a week's worth of data, giving you a fresh and relevant snapshot of your site's traffic trends.
The Segment Report
The Segment Report provides insights into customer searches, orders, sessions, and channel usage over the last six months. It features period-on-period graphs that compare the most recent three-month data with the preceding three months, offering a clear view of evolving customer interaction trends. This report is updated daily to ensure you have the latest information available.
Orders Per Customer Reports
This report includes a chart that shows the proportion of customers with 1, 2, 3, and 4 or more orders in the most recent 3 months and previous 3 months. It also shows a period-on-period comparison, demonstrating the trend in the number of orders per customer. The graph shows the percentage of change for each order segment in this 3-month period compared to the previous 3-month period, and whether the change is positive (growth) or negative (decline).
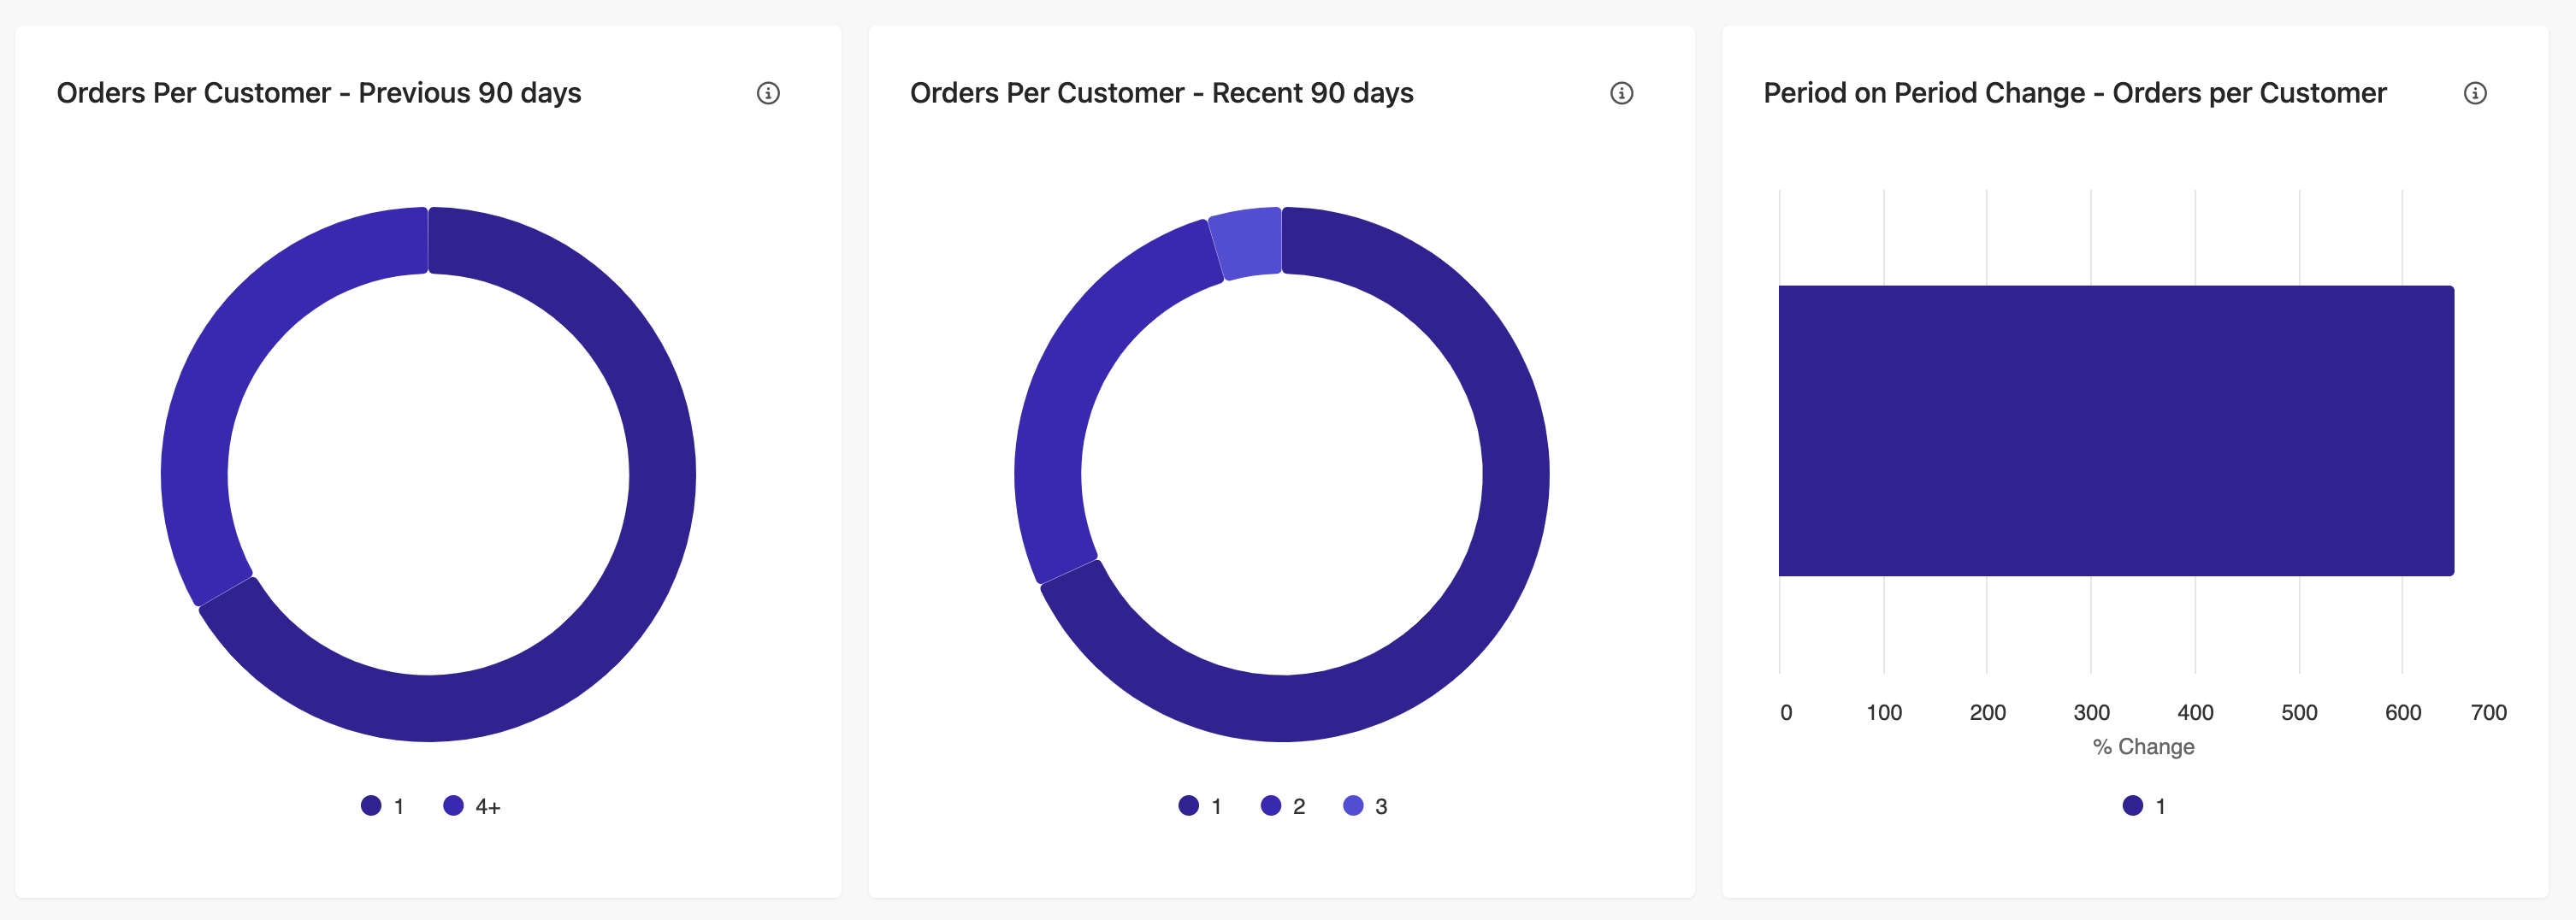
Figure 10: Screenshot of the Channels Per Customer Report in Sitecore CDP and Personalize
Channels Per Customer Report
Explore customer engagement across different channels with a chart detailing the number of channels (1, 2, 3, and 4+) used by customers in both the recent and previous three-month periods. This report provides a clear period-on-period comparison, revealing trends in the diversity of channel usage per customer.
The graph highlights the percentage variation in channel usage for each segment during these two consecutive three-month periods, indicating whether there's an increase (growth) or decrease (decline).
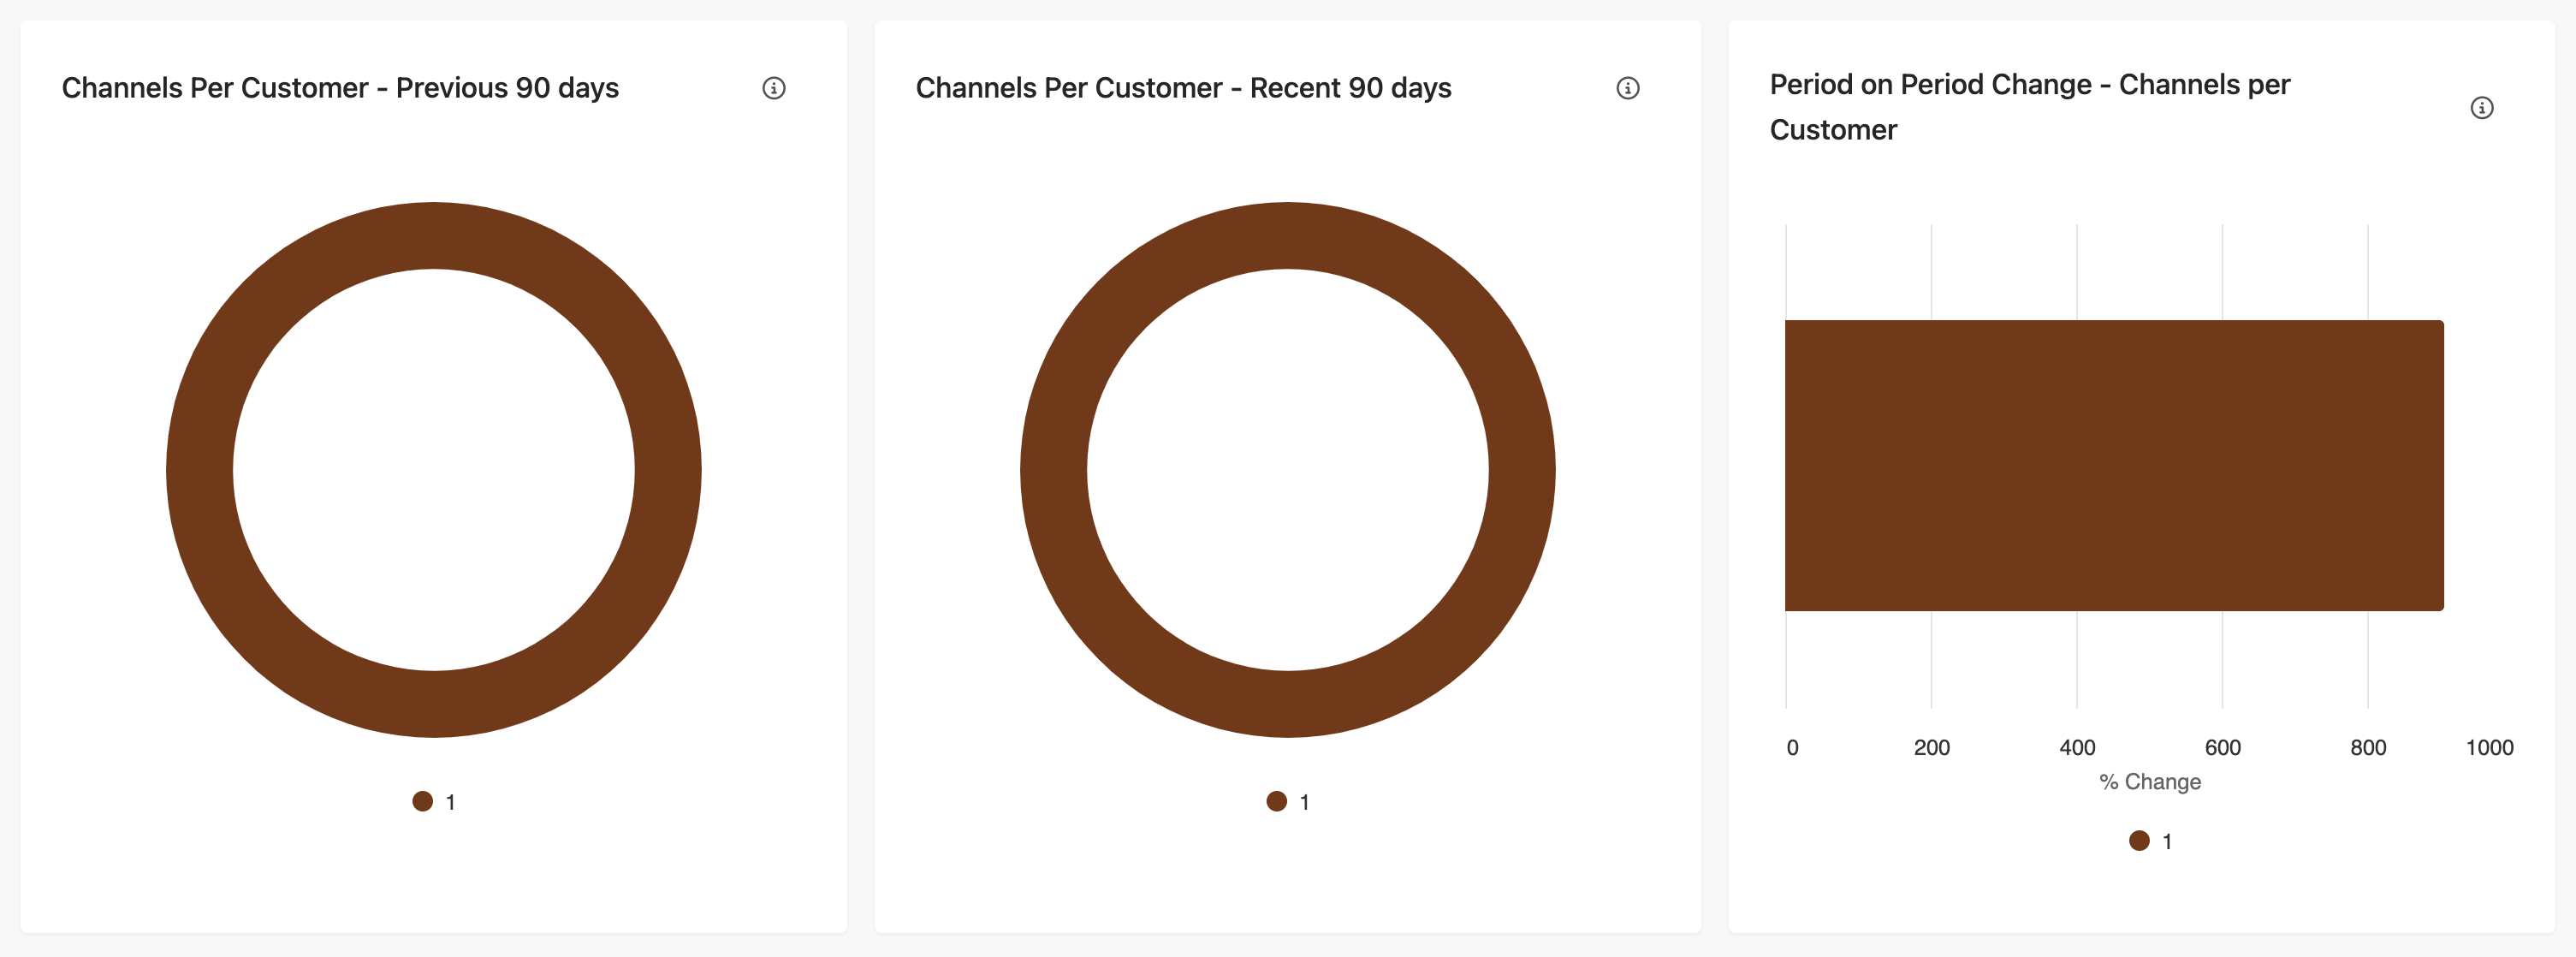
Figure 11: Screenshot of the Sessions Per Customer Report in Sitecore CDP and Personalize
Sessions Per Customer Report
This report features a chart that delineates the distribution of customers based on their number of sessions (1, 2, 3, and 4+ sessions) during the most recent three months compared to the previous three. It includes a period-on-period analysis, shedding light on the trends in session frequency per customer.
The graph provides a clear visual of the percentage change in session counts for each segment across these two three-month intervals, highlighting whether there's been an increase (growth) or decrease (decline) in customer engagement.
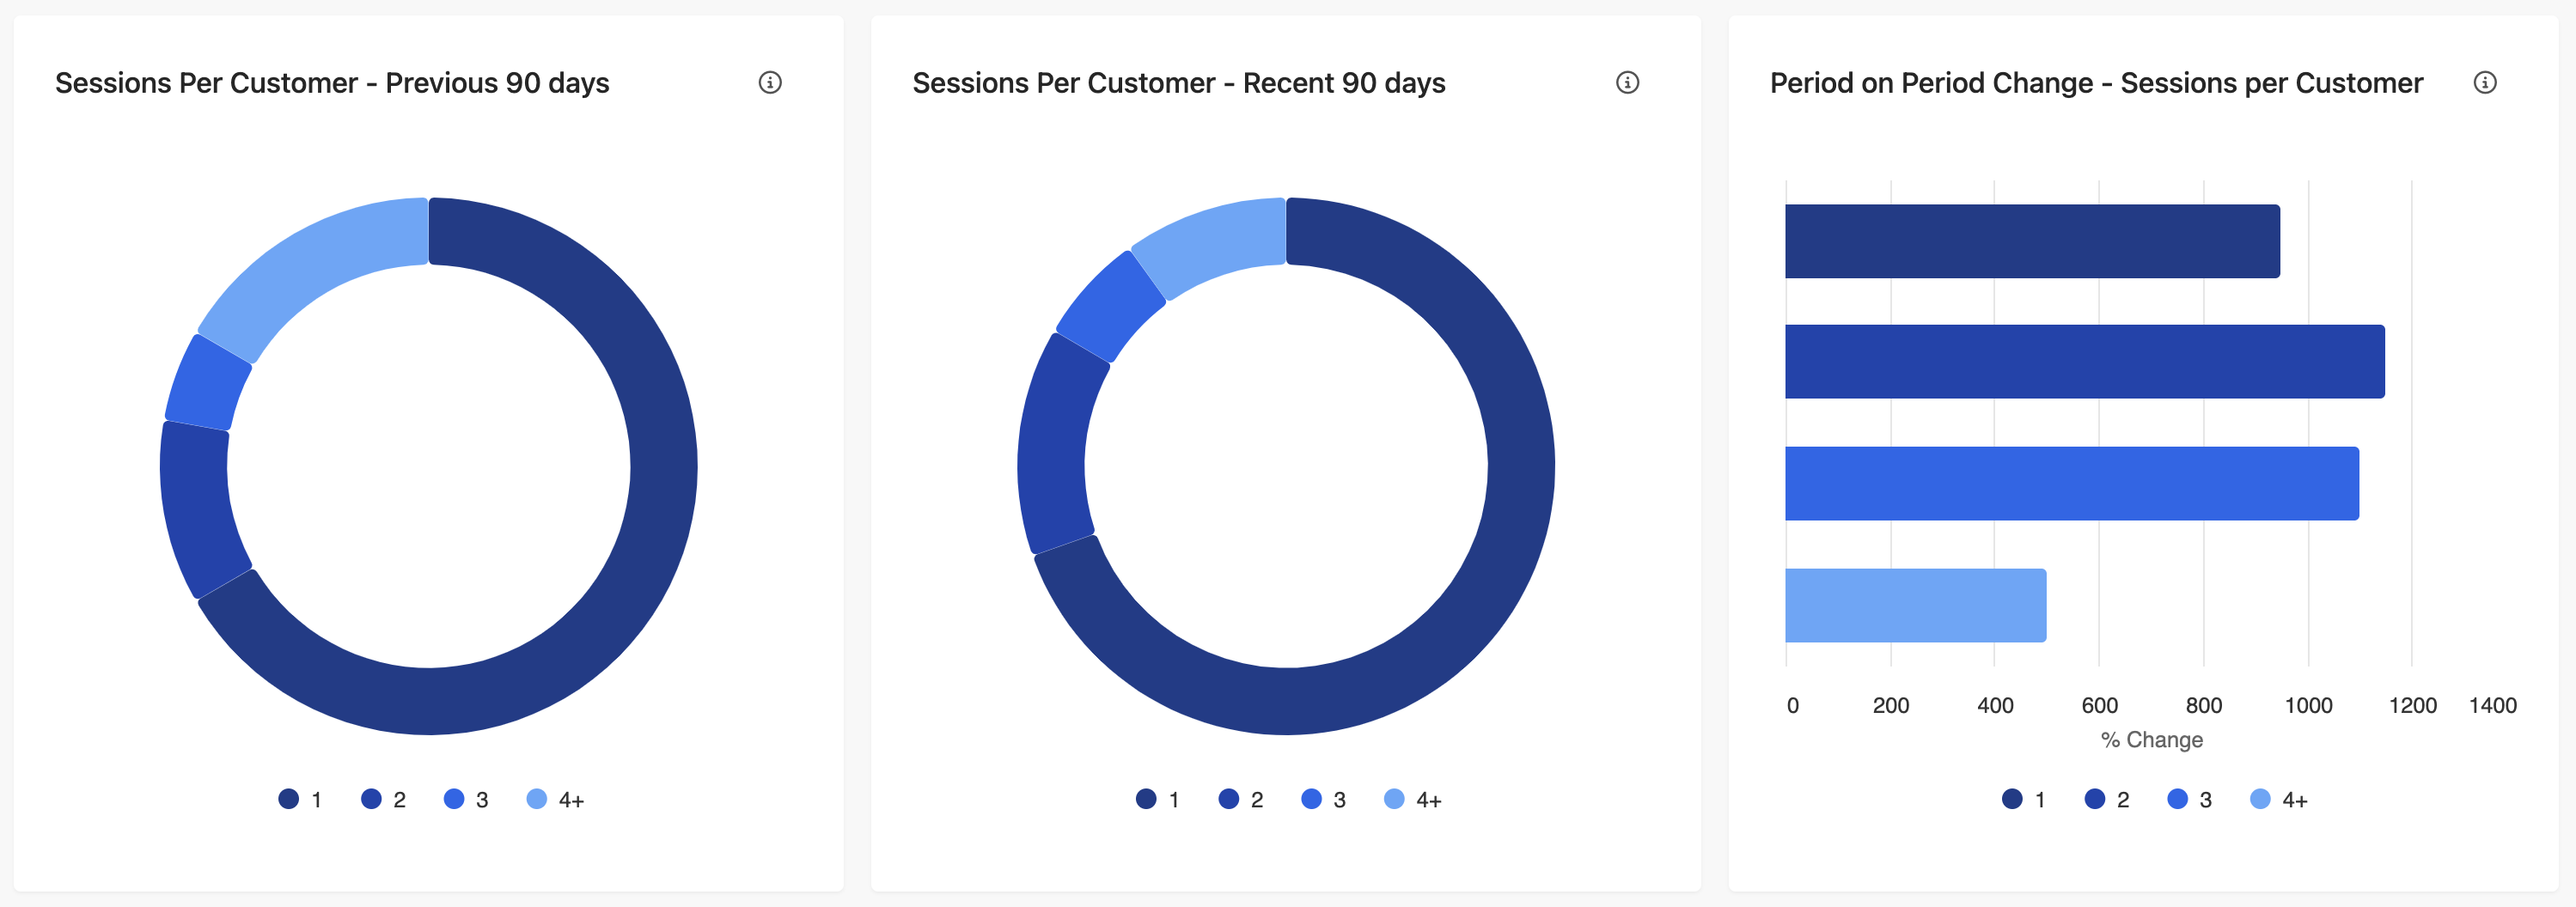
Figure 12: Screenshot of the Suspected Bot Traffic Report in Sitecore CDP and Personalize
The Suspected Bot Activity Report
Located in the Customer Analytics section, the Suspected Bot Activity report sheds light on atypical traffic and guest behaviors that may be the result of bots. This report focuses specifically on cart, event, and bounce bots, helping you distinguish between regular and unusual traffic patterns and pinpoint potential bot-related anomalies.
Key Considerations When Using the Report:
- Bot Detection Nuances: The report is designed to identify suspected bot activities based on various analytical methods. Be aware that some legitimate users might be mistakenly flagged as bots, and some actual bots may go undetected.
- Session Classification: Only visitor sessions are subject to classification as suspected bot activities. Sessions identified as belonging to customers are not included in this bot analysis.
- Bot Nature: Remember, not all bots have malicious intent – many are programmed to scrape information from sites. However, understanding the extent of bot traffic is crucial, especially to identify any potentially harmful activities.
- Site Behavior Variations: Remember that typical site behaviors can differ widely. Factors like advertising, email campaigns, and seasonal trends should also be considered when interpreting traffic data.
- Report Loading Time: The report may take about a minute to load. Rest assured, the data is updated every 24 hours to provide the latest insights.
Utilize this report to refine your understanding of site traffic, ensuring that your analysis and decisions are based on human interactions, and to stay alert to any bot activities that could impact your business operations.
Suspected Bot Traffic Reports
The initial section of the Suspected Bot Activity Report offers a range of traffic metrics, serving as a valuable context for analyzing potential bot activities.
Utilize the report's filter feature to customize the time period for which you wish to view data, with the default setting showcasing the past month's statistics.
To tailor the report according to your chosen filters, simply click 'Apply'. If you wish to return to the standard view, select 'Reset filters'. This flexibility allows for focused examination of suspected bot traffic relevant to your specific time frame.
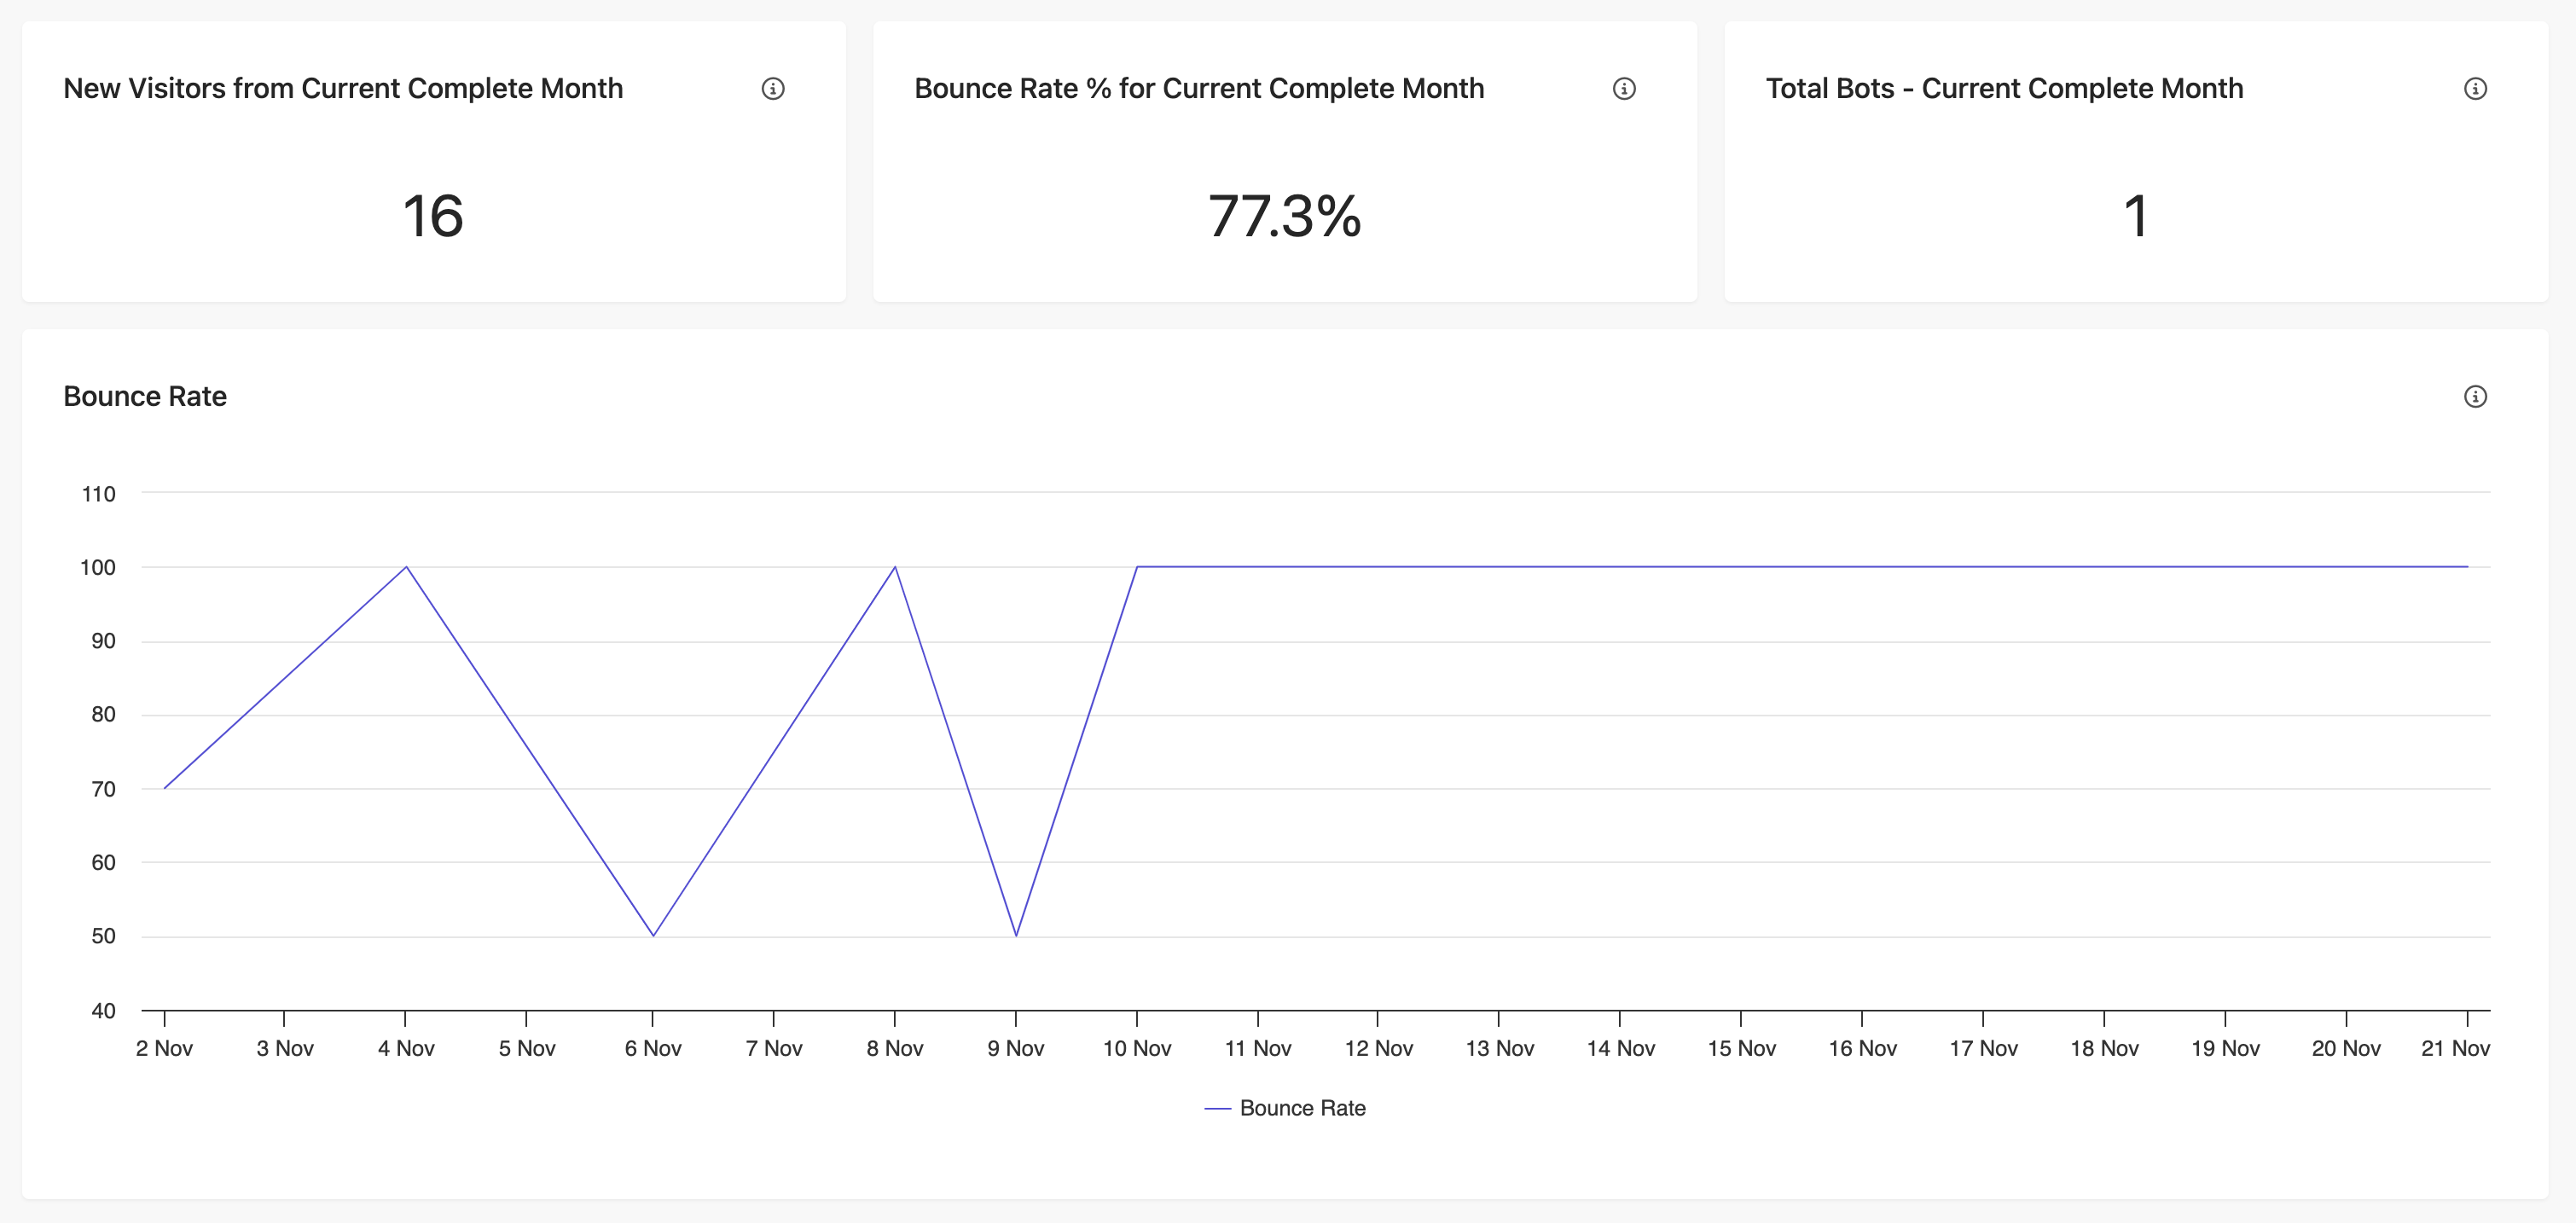
Figure 13: Screenshot of the Average Session Duration Insights Report in Sitecore CDP and Personalize
Monthly Visitor and Bot Activity Insights
- New Visitors - Recent Complete Month: Displays the count of unique visitors for the last full calendar month. A (green/red) figure next to an (up/down) arrow represents the trend in visitor numbers, offering insight into potential bot activity proportions.
- Bounce Rate % - Recent Complete Month: This metric shows the bounce rate, i.e., the percentage of single-page sessions, for the most recent full month. High one-page sessions could suggest bot involvement. The trend in bounce rates is indicated by a (green/red) number next to an (up/down) arrow.
- Total Bots - Recent Complete Month: Presents an estimated percentage of bot sessions out of the total sessions for the latest full calendar month. The (green/red) number beside an (up/down) arrow shows the trend in bot session counts.
- Daily Bounce Rate Graph: A day-by-day graphical representation of bounce rates for the last complete month. This graph is instrumental in quickly spotting any sudden increases in bounce rates, which could be indicative of significant bot activity.
Average Session Duration Insights
Session length can often signal bot activities. This graph presents the daily average duration of sessions for each day in the last full calendar month, helping you monitor potential bot behavior.
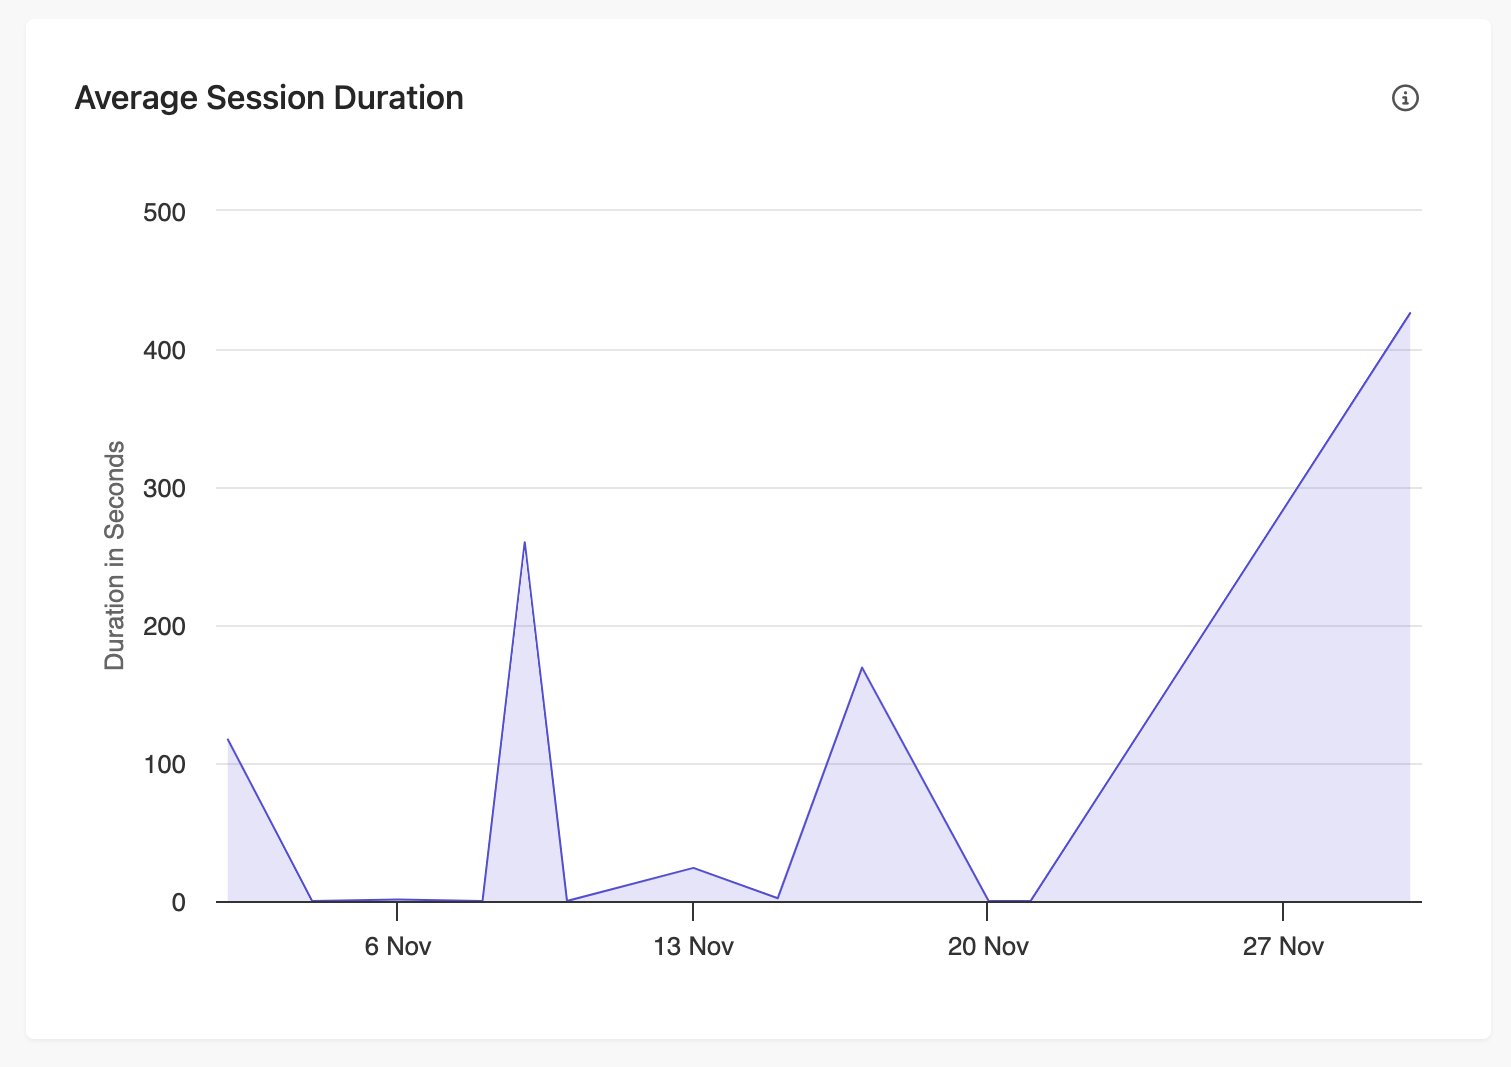
Figure 14: Screenshot of the Daily Traffic Report in Sitecore CDP and Personalize
Daily Traffic Report
Sudden fluctuations in session counts may hint at bot activity. This graph outlines the daily number of sessions throughout the most recent full calendar month. Days with exceptionally high session numbers are flagged as potentially suspicious and are subject to further scrutiny in subsequent graphs.
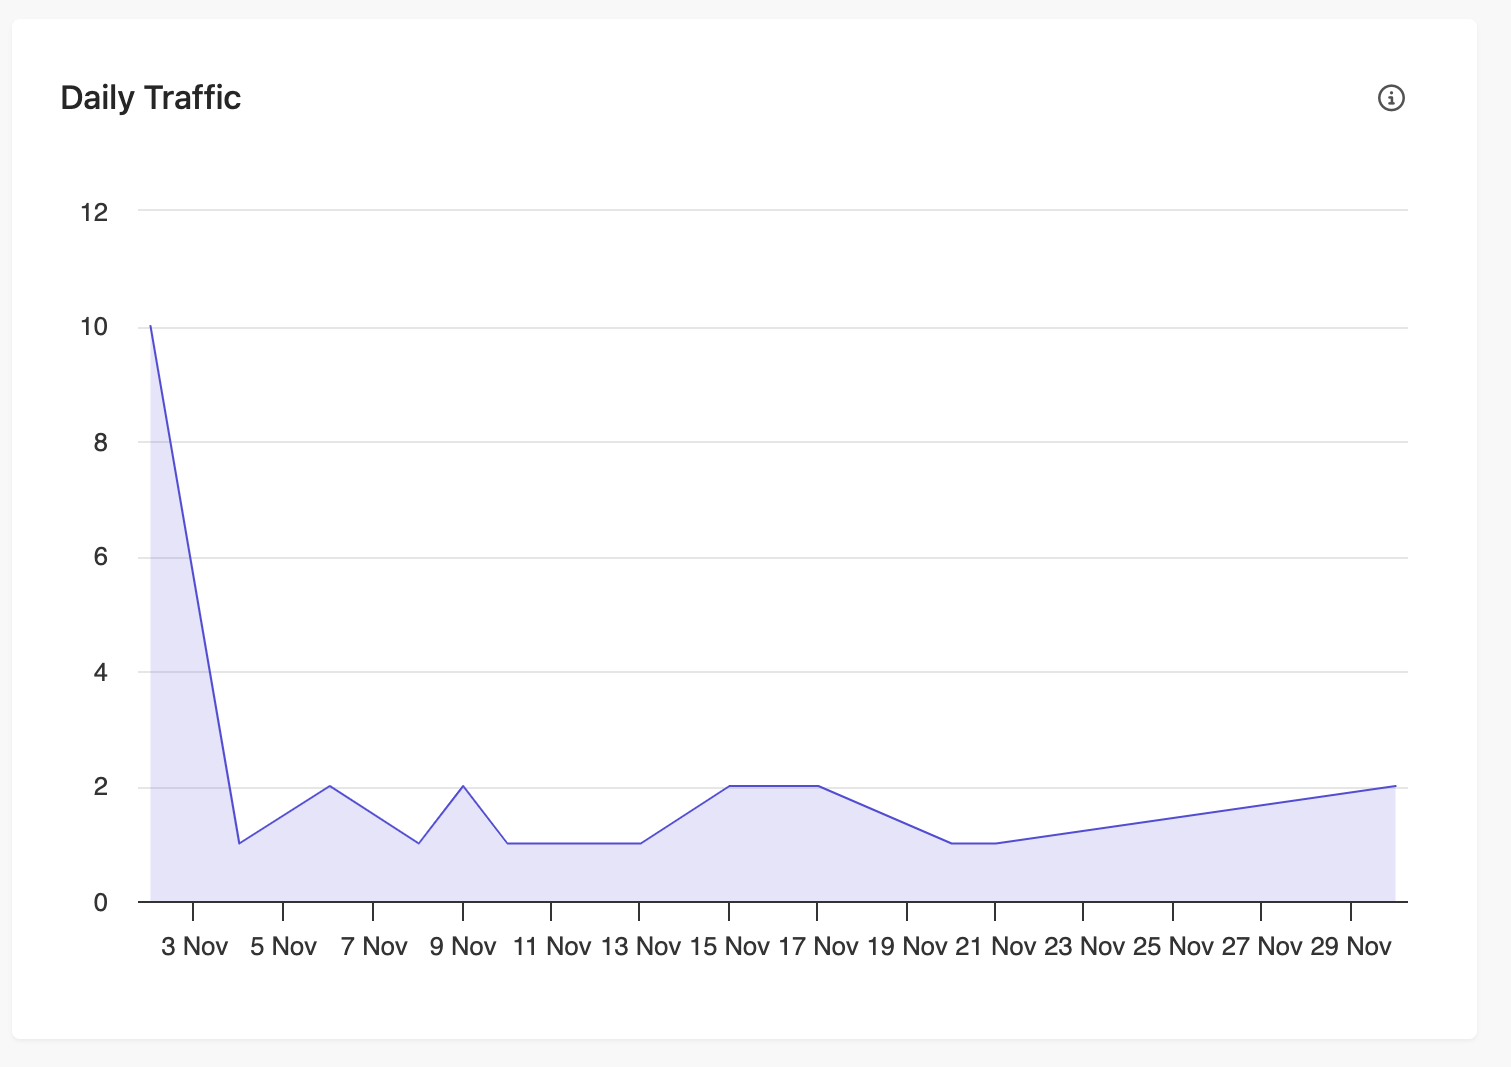
Figure 15: Screenshot of the First Page - Suspicious Date Report in Sitecore CDP and Personalize
First Page - Suspicious Date Report
This table highlights the most visited landing pages on the date with the peak site visits, as identified in the Daily Traffic graph. It aids in confirming or refuting suspected bot activity. For instance, if the top landing page corresponds to an ad or email campaign, it likely indicates the high traffic stems from genuine user engagement.
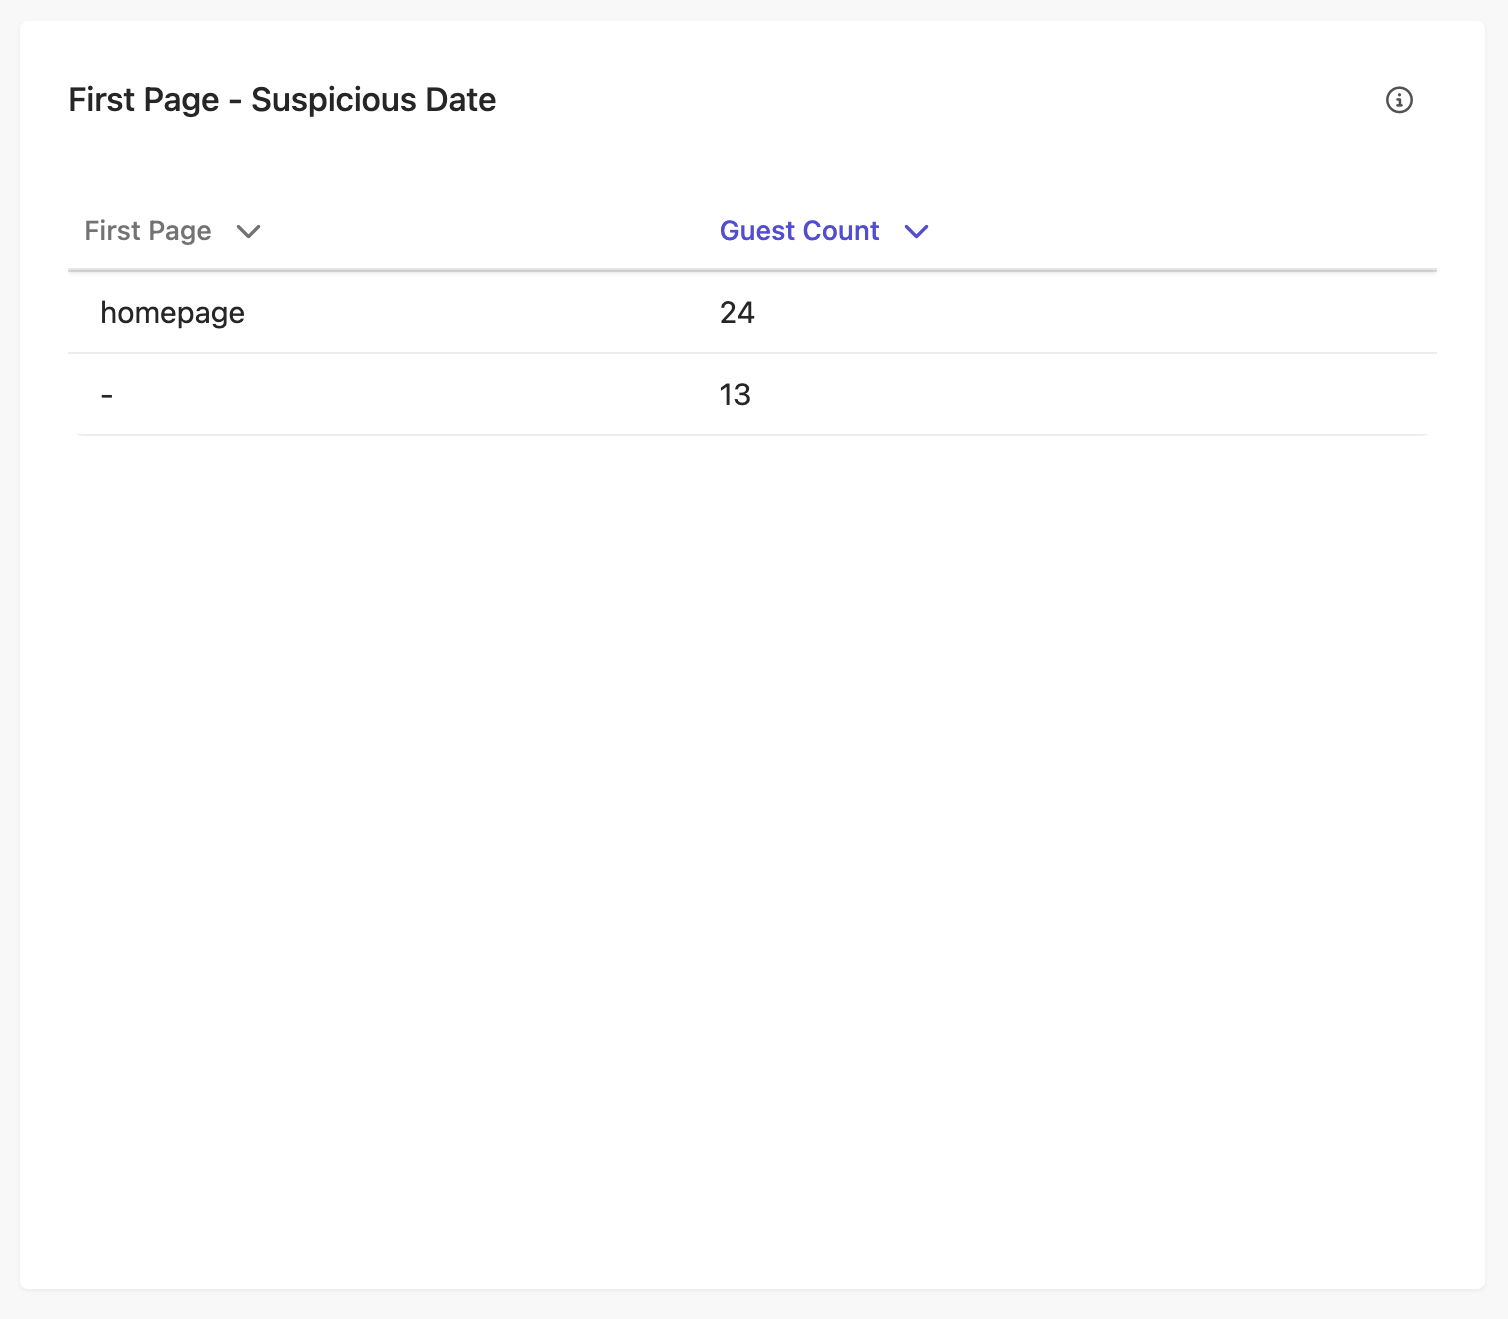
Figure 16: Screenshot of the reports in the Summary Report Dashboard in Sitecore CDP and Personalize
Guest Information - Suspicious Day Traffic Report
On the day marked with the highest site visits in the Daily Traffic graph, this table provides detailed session information for each guest. It's an essential tool for scrutinizing individual guest profiles to determine if they might be bots.
To delve deeper into a guest's details, simply click on their reference number.
Organize the data to your preference by clicking on any column heading. Sorting by session count can be particularly insightful, as a guest with numerous sessions and brief durations is more likely to be a bot.
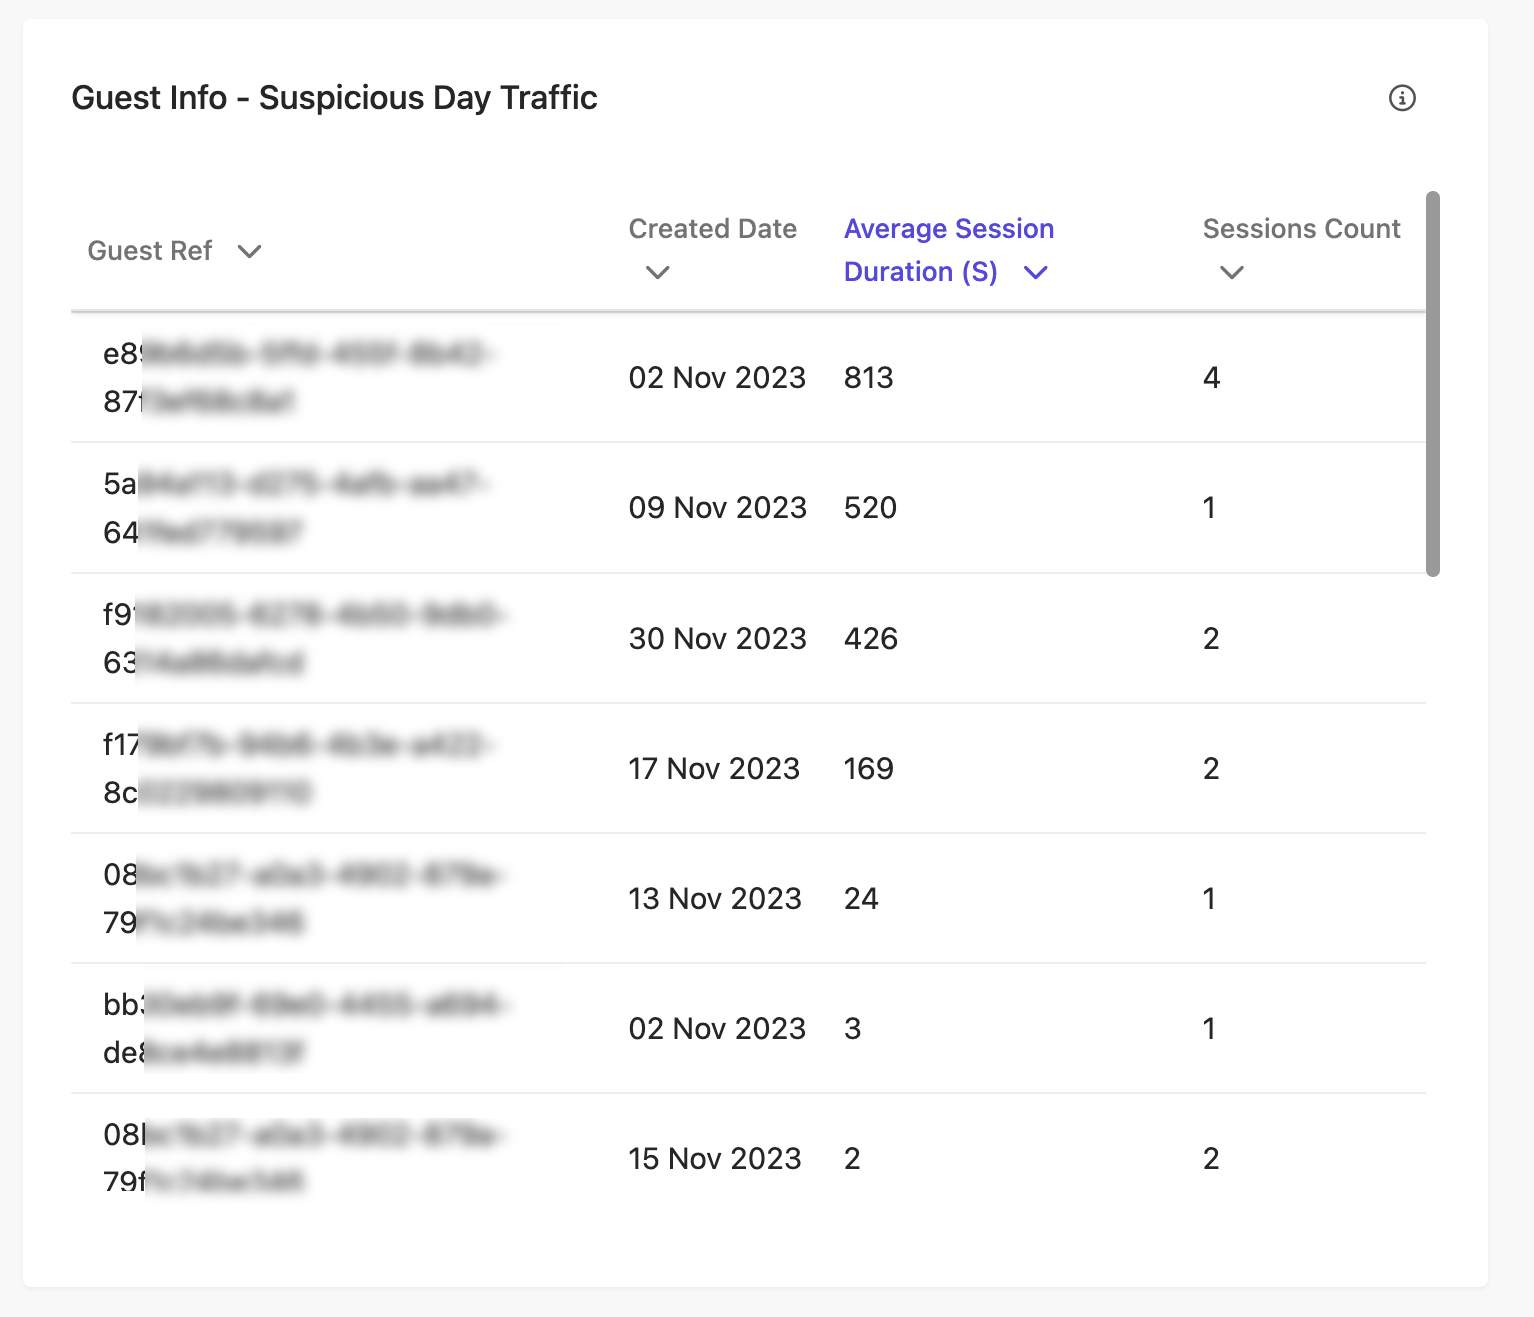
Figure 17: Screenshot of the Guest Info - Suspicious Day Traffic report in Sitecore CDP and Personalize
The Events Report (BETA)
The Events Report BETA offers a streamlined way to track and analyze your organization's key activities, including webinars, marketing campaigns, and user interactions, over any chosen timeframe. It provides an aggregated view of page views, user engagements, and custom events, essential for understanding audience behavior and campaign performance. This tool allows for flexible timeframe selection, making it ideal for evaluating specific events or periods. Its user-friendly interface and customizable reporting capabilities make it an invaluable asset for gaining insights into user preferences and enhancing data-driven decision-making, ultimately guiding strategic planning and optimization efforts.
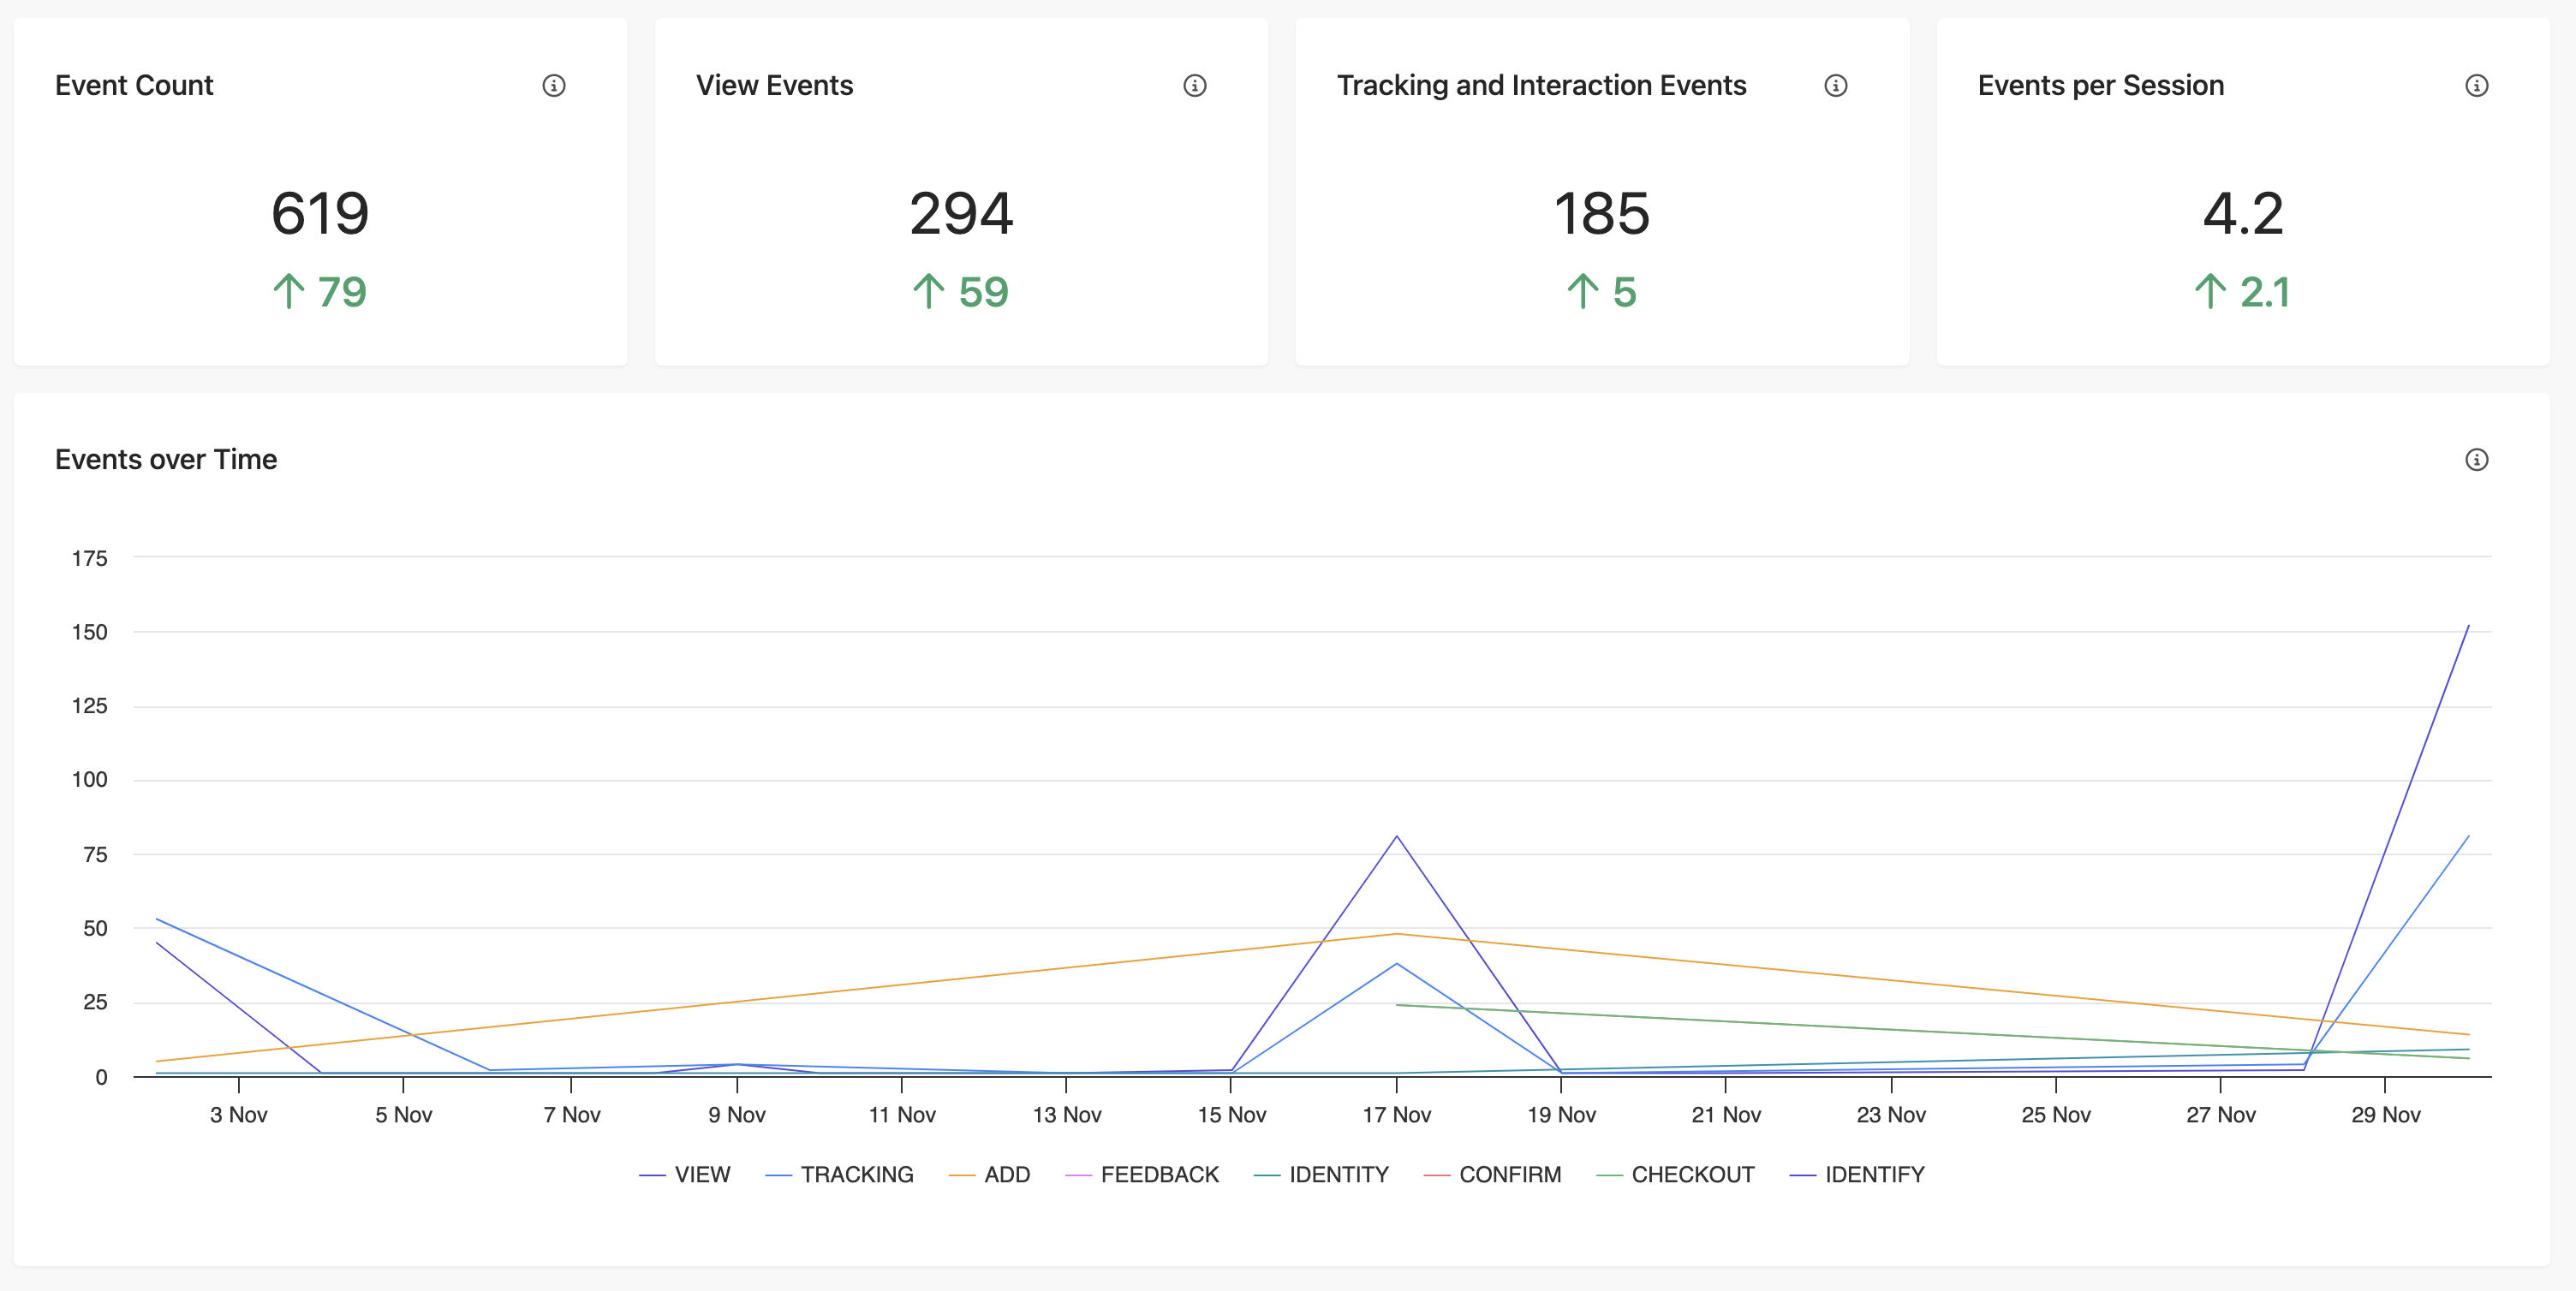
Figure 18: Screenshot of the Events Over Time Report in Sitecore CDP and Personalize
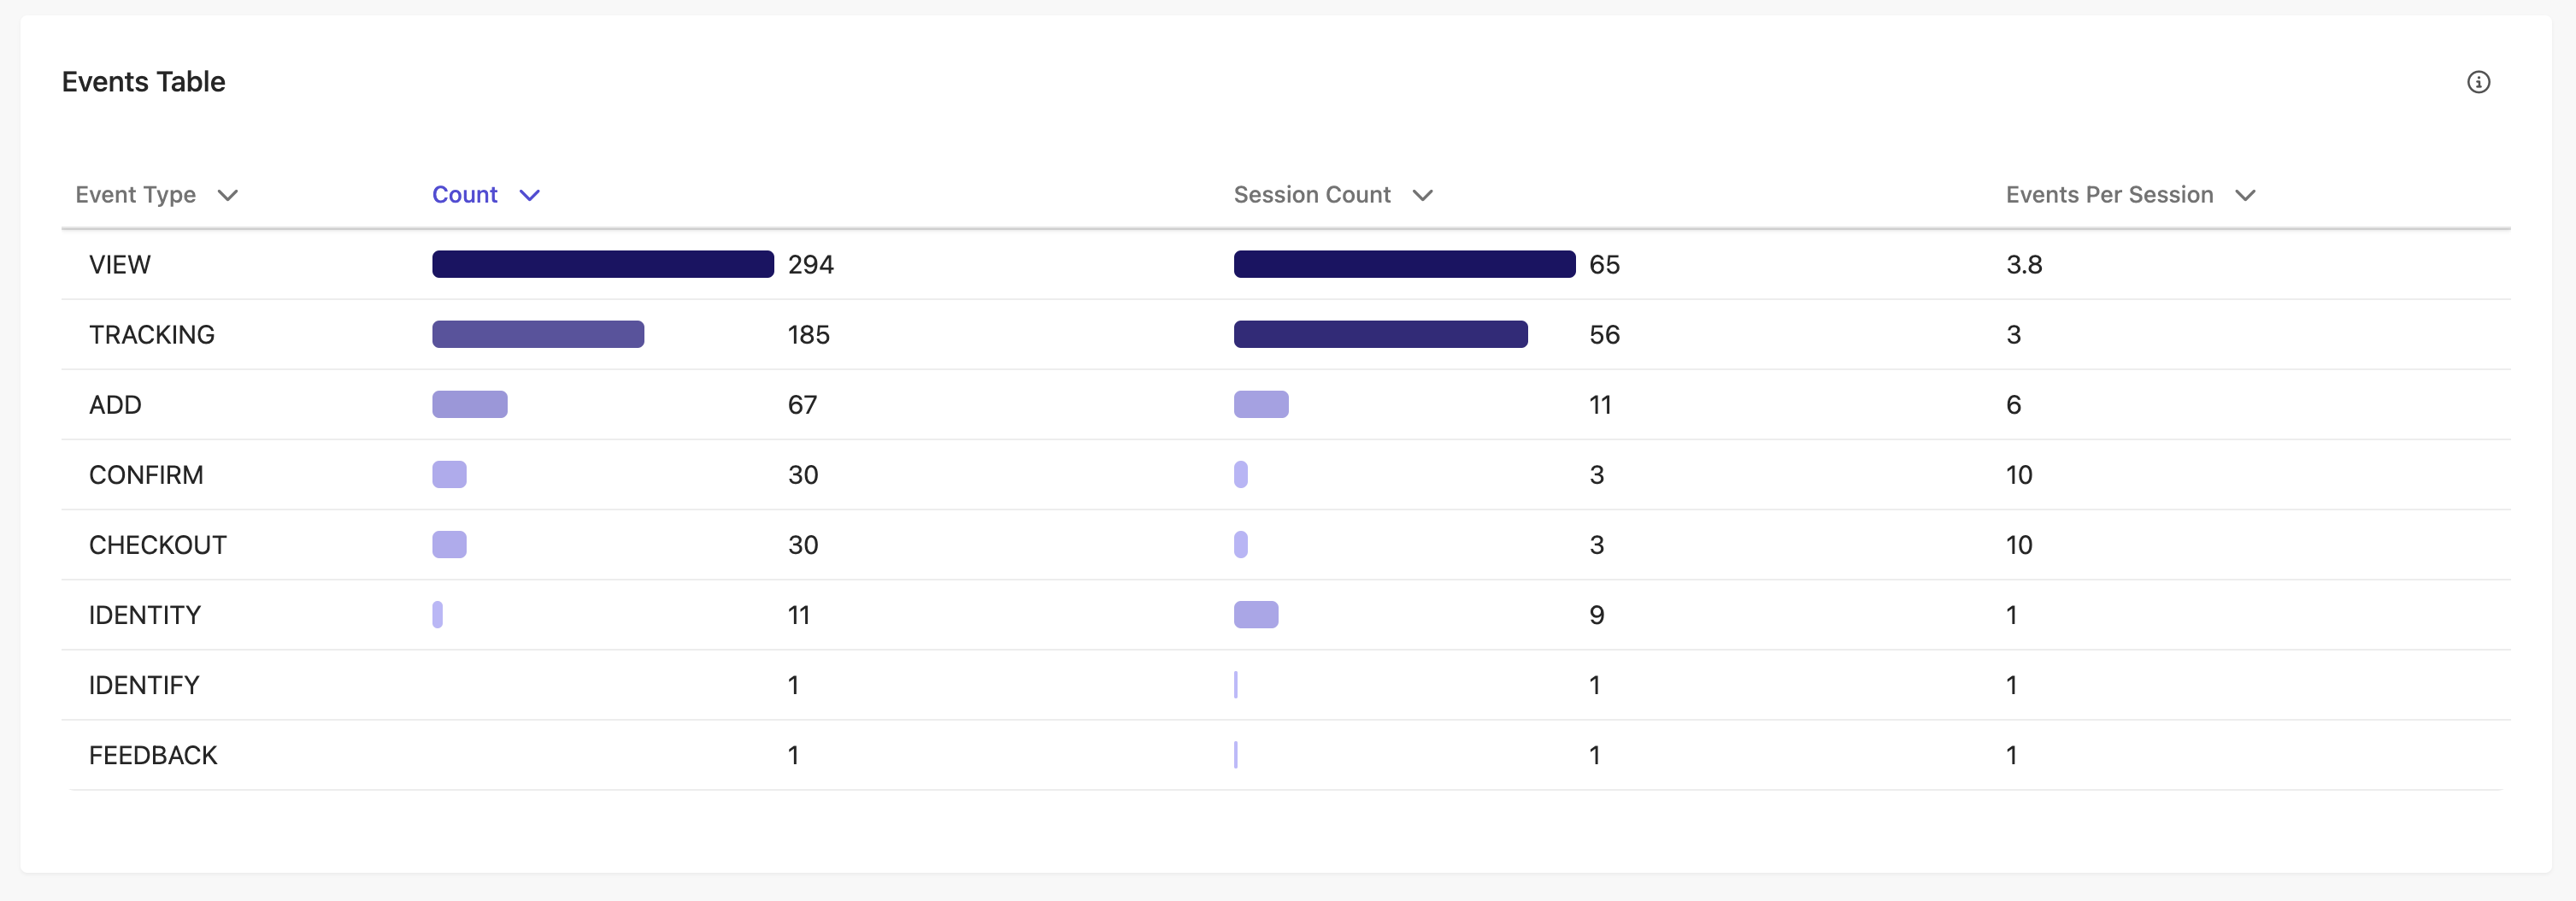
Figure 19: Screenshot of the Events Table Report in Sitecore CDP and Personalize
Analyzing Data in Sitecore CDP Dashboards
Sitecore CDP offers a comprehensive suite of reports that provide invaluable insights into various aspects of digital marketing and customer engagement. From tracking the nuances of customer interactions in the Segment Report to deciphering potential bot activities with the Suspected Bot Activity Report, each report is tailored to enhance your understanding of user behavior and campaign effectiveness. The versatility of these reports empowers organizations to make data-driven decisions.
As we have explored the features and benefits of these reports, stay tuned for Part 2, where we will dive deeper into the data analysis techniques for each report, offering you practical insights and strategies to maximize the potential of Sitecore CDP in your marketing endeavors.
Happy reporting!

Meet Theresa Gutierrez
Sitecore Strategist | Sitecore Strategy MVP
⛳ 🌮👩🏻💻
Theresa, aka 'T', is a high-energy marketing creative with 8+ years of experience across various industries. She's passionate about delivering strategy and design, with a focus on Sitecore SaaS technologies. T is an avid golfer and loving dog momma, appeased only by delicious food and a bevy of something bubbly. Cheers!