Google Analytics 4 Reporting
Tracking your data in Google Analytics 4 (GA4) looks a little different after Google’s recent update from Universal Analytics (UA). Even though there are less predefined reports in GA4 compared to UA, we now have the functionality to create endless custom reports for our tracking needs.
There are still several default reports in GA4 for you to use in our data collection and analysis. This blog will focus on the pages and screens report in GA4 and will cover how to access, read, and customize it for a better understanding of how users are interacting with our site. This will help us understand what content is most interesting and gain a lot of insight on what content is performing well. The insights we can gain from this report can inform the marketing, content, and design decisions on our website.
The Pages And Screens Report In GA4
The pages and screens report in GA4 breaks down the performance of page and screen interactions for both your website and mobile apps. Monitoring the pages and screens report allows us to see what your users are looking at on your website or app. Screens are treated similar to pages in Analytics, where it tracks the pages that users are viewing within your mobile apps.
In this report, a pageview includes:
- The initial load of a page
- The reload of a page
- A revisit on the same page
This report is a great starting point for diving deeper into your data analysis which we will go over in later sections.
Where To Find The Pages And Screen Report
Follow these steps to access your pages and screens report in your GA4 property:
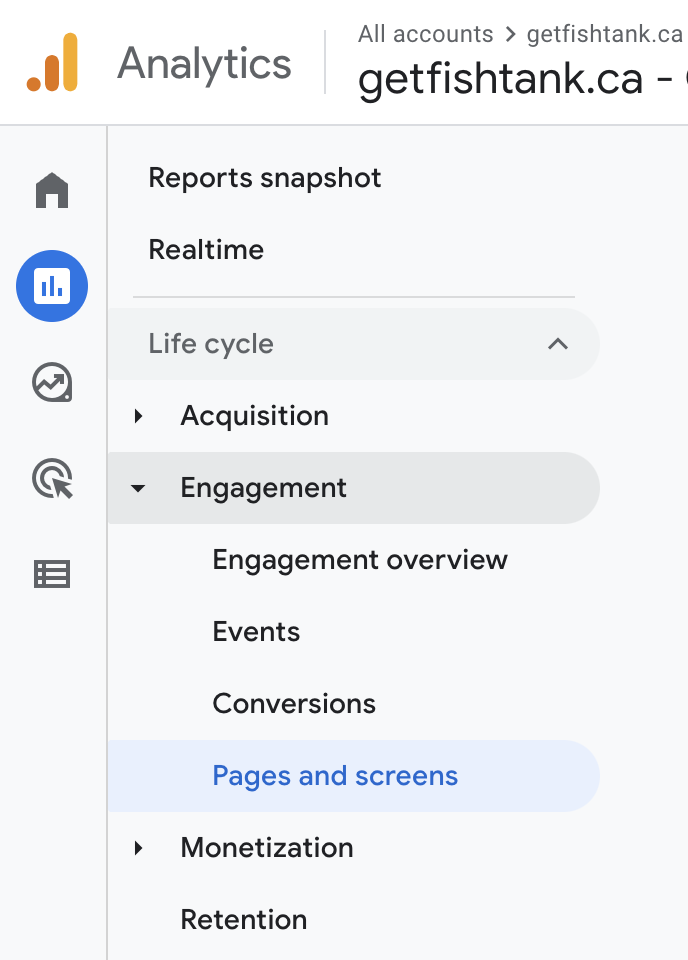
1. Navigate to the Reports tab in your GA4 property.
2. Under the Life cycle section, click Engagement to open the drop down menu.
3. Under the Engagement menu, select the Pages and screens report.
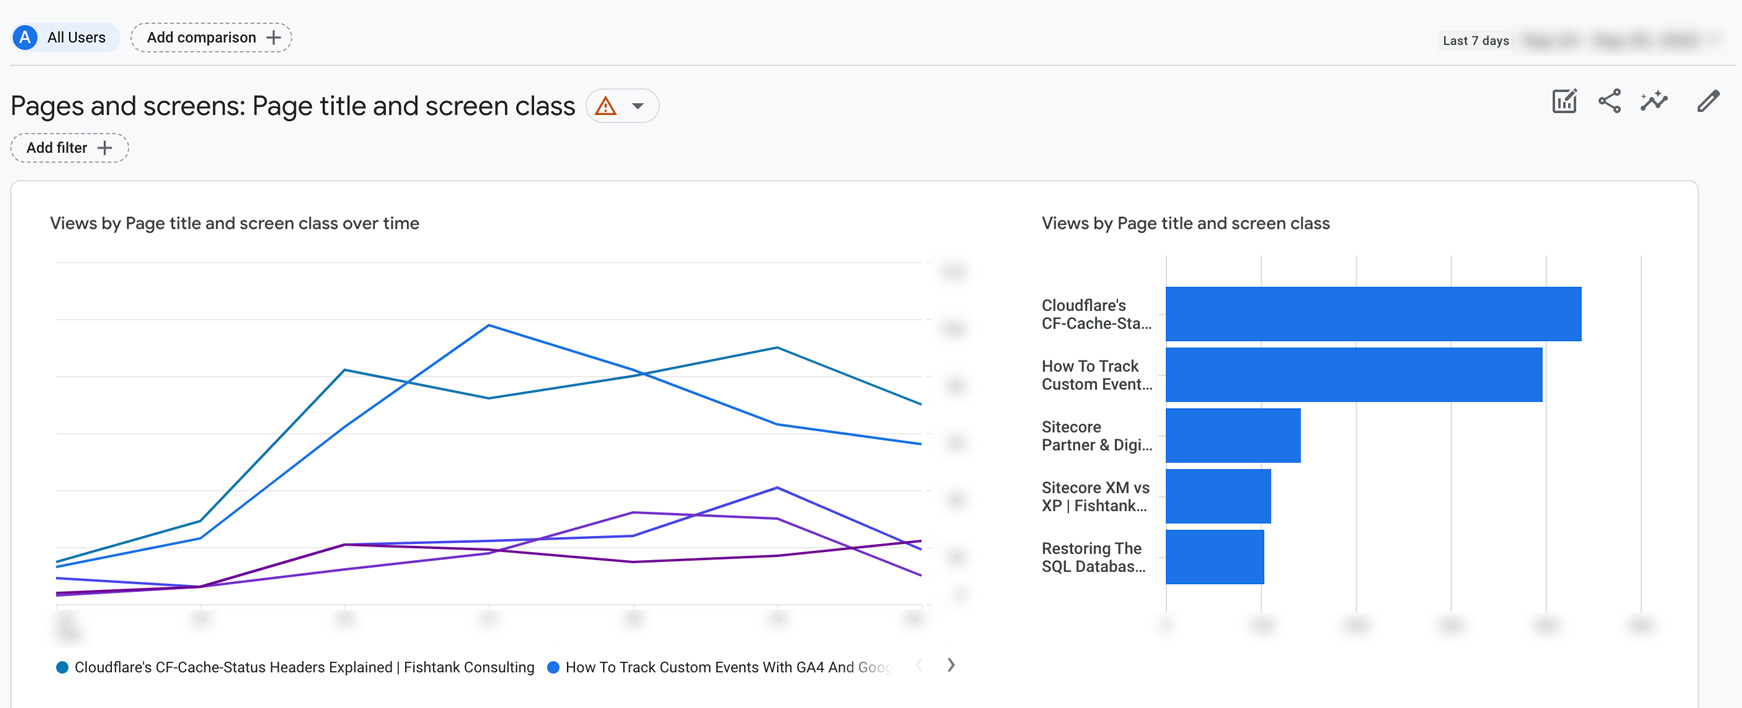
After opening the report, you will see two graphs side-by-side, one bar and one scatter plot. The bar graph on the left displays your most popular pages with all users, while the scatter plot graph shows users and new users by Page title and screen class on the right.
After you scroll down, you’ll see an overview report of the interaction with each page/screen for your website or mobile apps. The data available is broke down according to Page title and screen class. This means GA4 is filtering pages in this report by the web page title and the developer-supplied screen name used on your site. If you prefer to use a different dimension than the Page title and screen class, you can use the drop down menu in the first column to select a different dimension.
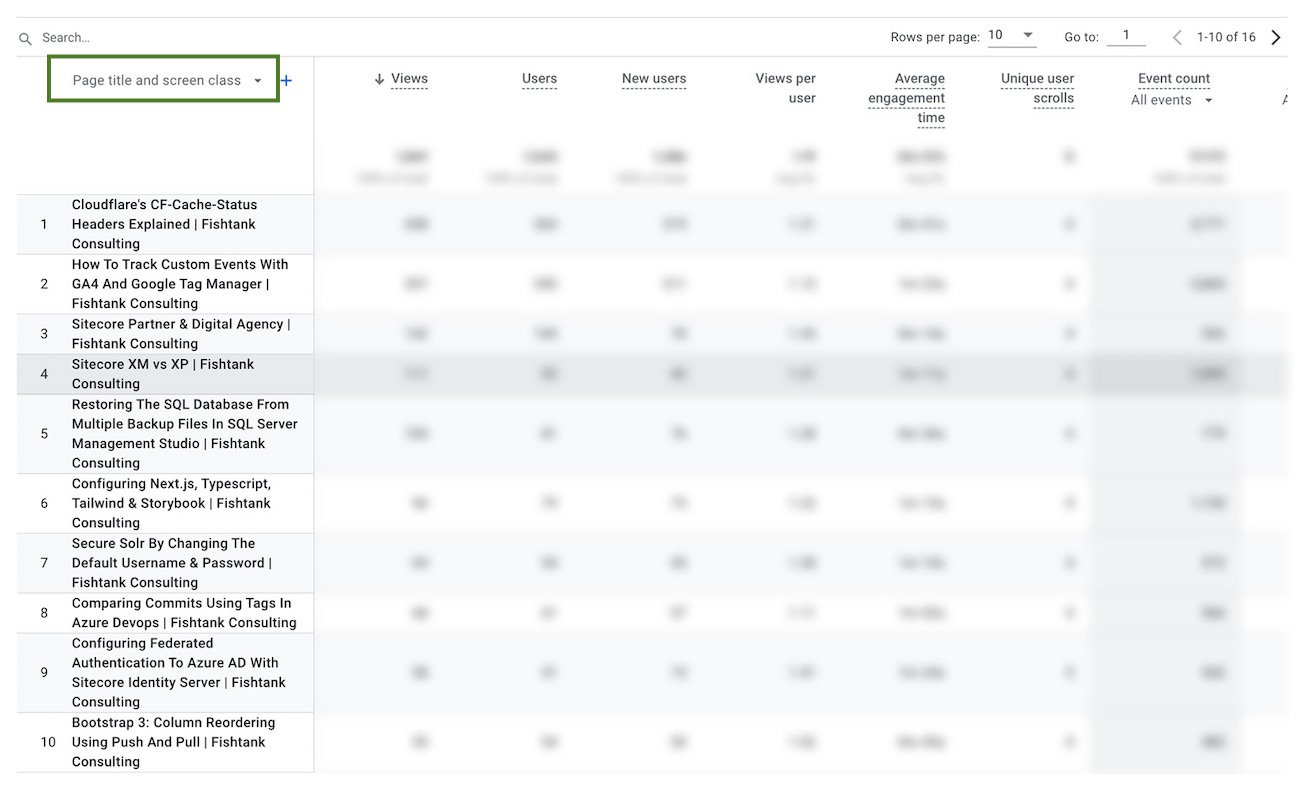
You’ll see the following metrics are included in the report by default:
- Views
- Users
- Views per user
- Average engagement time
- Unique user scrolls
- Event count (All events)
- Conversions (All events)
- Total revenue
GA4 functionality allows the capability to edit and customize standard reports to better meet our analytics needs.
Customizing Your Pages And Screens Report
There are two ways you can easily customize your pages and screens report to dive deeper into your data. Let’s go over them.
Comparisons
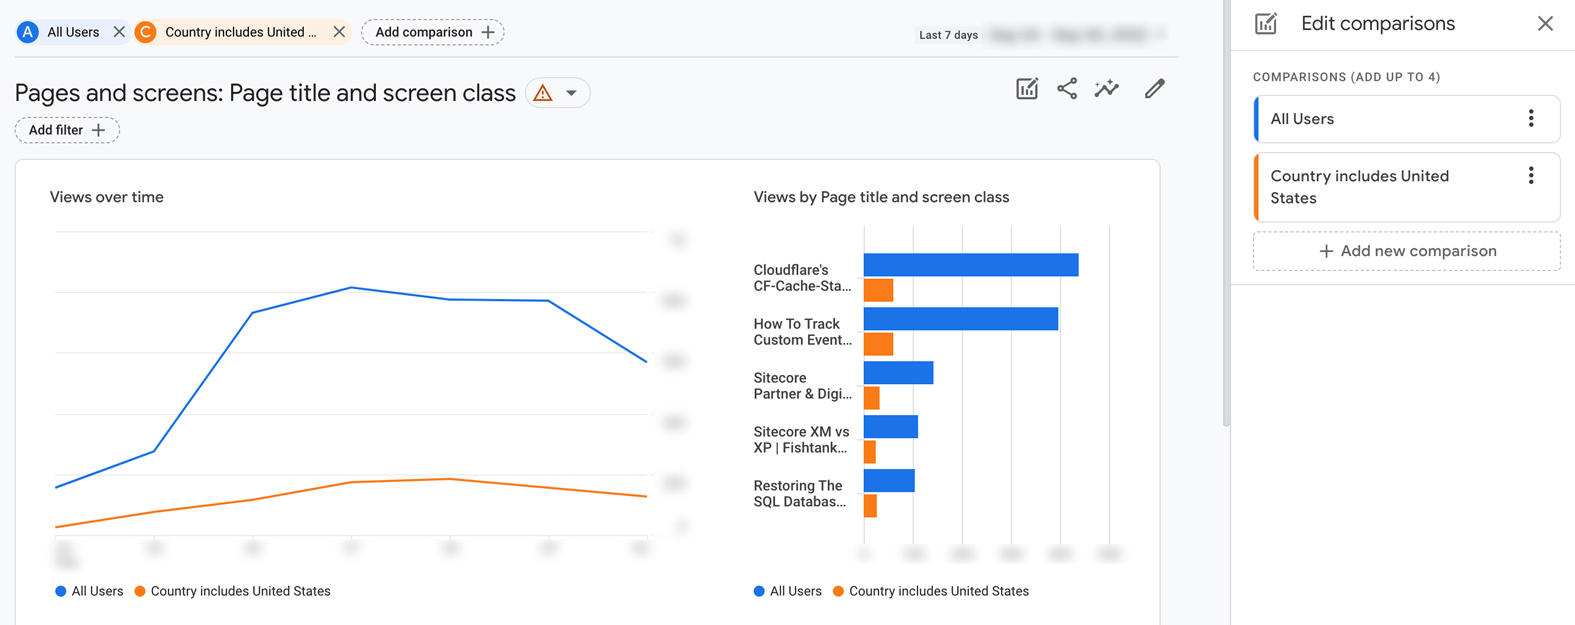
The first method is by using Comparisons. This feature can be used across all standard reports in GA4 to compare different segments of data. In order to set this up, go to the top of the report and click Add comparison +.
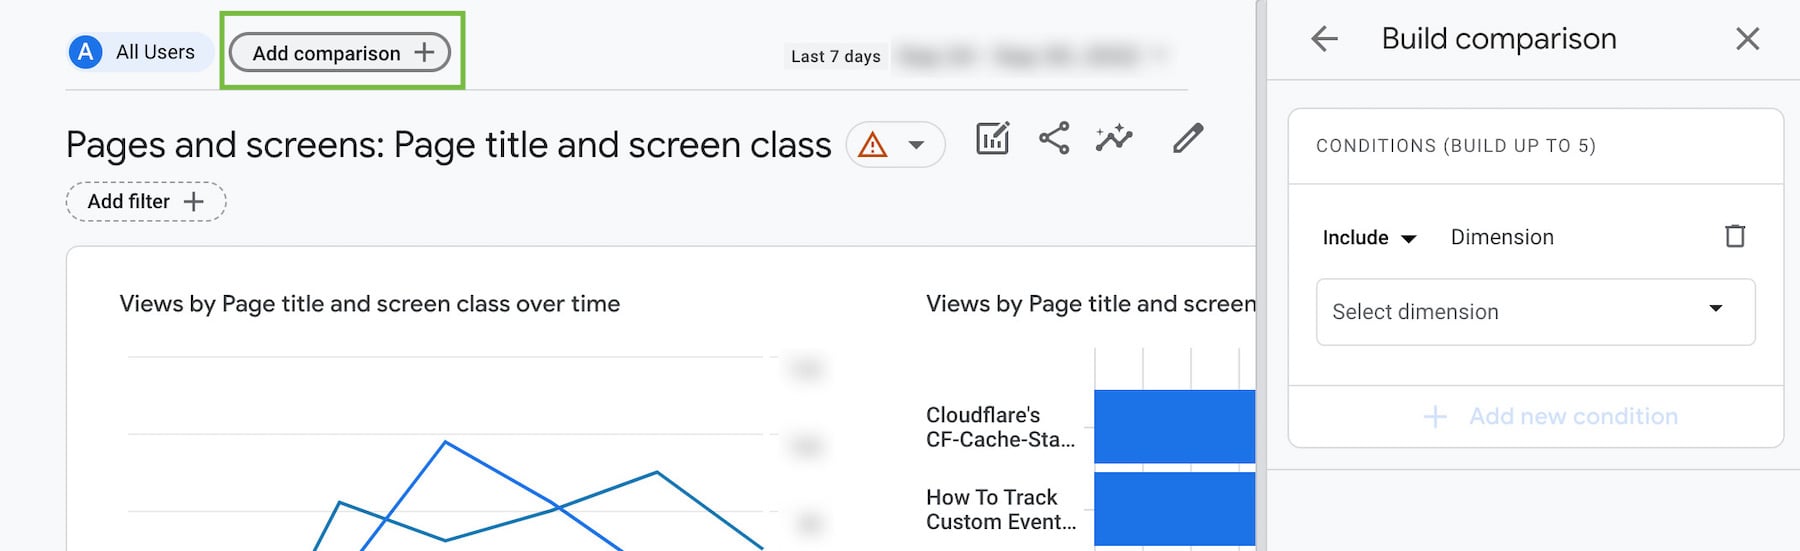
This functionality allows us to add a visual layer on top of the graphs on our pages and screens report. We can use different dimensions to compare or exclude specific groups of users or events you want to track more closely in your report.
In this example, we added a specific comparison where we filtered our Page and screens report using user data from the United States. This information is compared to all user data.
If you’re looking to better understand GA4 comparisons, check out our blog here.
Secondary Category
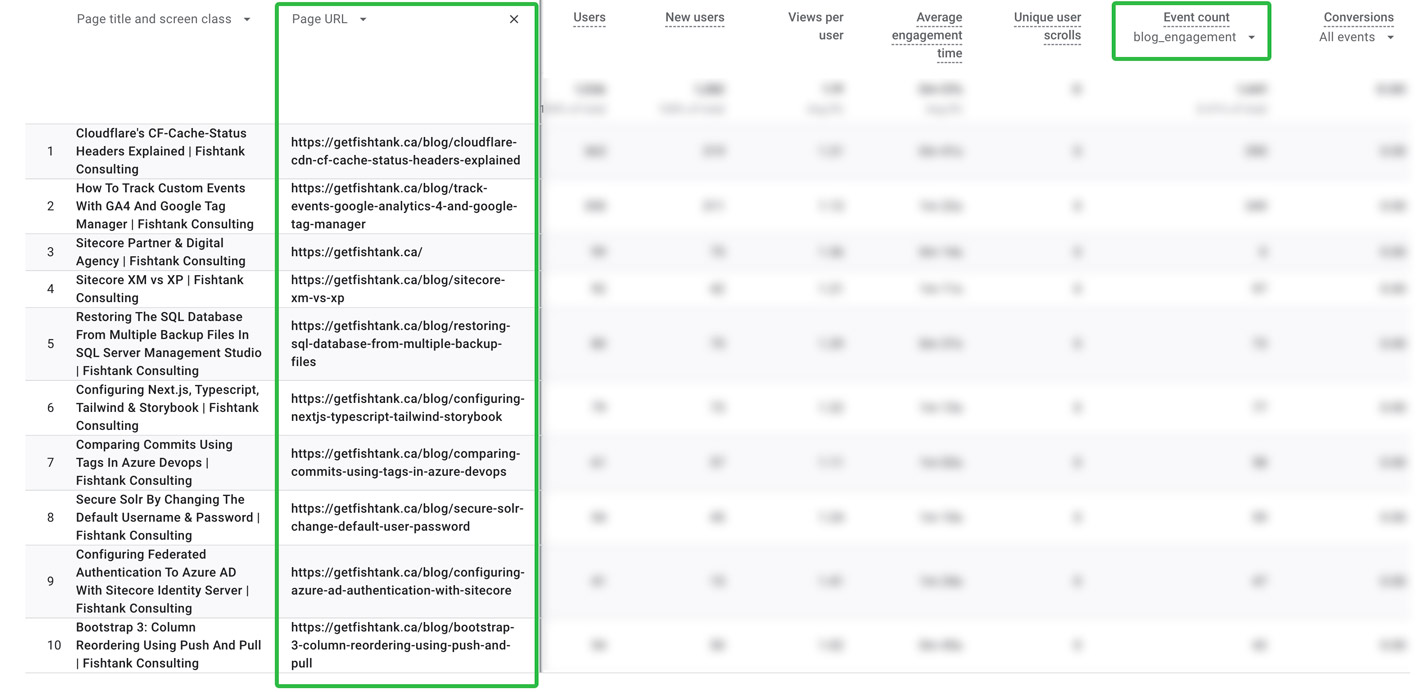
The other method for customizing your pages and screens report in GA4 is by adding a second category, or dimension. Click the + next to the first column and select a dimension from the drop down list. The following screenshot shows the Page URL as the secondary dimension. Another way to filter your data is by choosing a specific Event or Conversion Event to filter the data. In this example, we sorted the Pages by our blog_engagement event.
Why Is The Pages And Screens Report Important
Page and screen data is a very popular metric when it comes to data collection. This information tells us what pages your users are viewing and interacting with. Here are some insights your pages and screens report can give you.
Popular Blog Posts: By filtering the pages and screens report by blog pages, you’ll learn which content is doing well, likely due to higher organic traffic. The adverse will show us opportunities to optimize content based on which blogs are performing poorly.
Mobile App Performance: The pages and screens report can give insight on both your website and mobile app. By adding the Operating system (OS)metric to the report, we are able to see desktop OS as well as a mobile OS. This insight allows us to see if users are having difficulty accessing or interacting with certain screens on mobile. If you find there is high traffic to your checkout page that aren’t resulting in conversions, this could be an indication there might be an issue with your checkout system on your app.
Content Optimizations: The pages and screens report can show us a page analysis of the performance of specific changes on our website, like new website formats, marketing campaigns, or content optimizations. Take a look at the before and after of how users are interacting with your website changes.
Closing
The pages and screens report in GA4 is a great report to get familiar with. Especially in our efforts to learn GA4 and get accustomed to Google’s newest version of Analytics, this report is sure to be a favourite. This report, along with all the other standard reports in GA4, are easily customizable using the comparisons feature. You can also add different dimensions and metrics to filter the data to better meet your analytics needs.
How are you liking the new pages and screens report in GA4? Send us your thoughts, we’d love to know!
👋 Hey Sitecore Enthusiasts!
Sign up to our bi-weekly newsletter for a bite-sized curation of valuable insight from the Sitecore community.
What’s in it for you?
- Stay up-to-date with the latest Sitecore news
- New to Sitecore? Learn tips and tricks to help you navigate this powerful tool
- Sitecore pro? Expand your skill set and discover troubleshooting tips
- Browse open careers and opportunities
- Get a chance to be featured in upcoming editions
- Learn our secret handshake
- And more!


Meet Theresa Gutierrez
Sitecore Strategist | Sitecore Strategy MVP
⛳ 🌮👩🏻💻
Theresa, aka 'T', is a high-energy marketing creative with 8+ years of experience across various industries. She's passionate about delivering strategy and design, with a focus on Sitecore SaaS technologies. T is an avid golfer and loving dog momma, appeased only by delicious food and a bevy of something bubbly. Cheers!