Get Started With Explorations In Google Analytics 4
The default Reports section in our Google Analytics 4 (GA4) property gives us key business metrics. If there’s information that aren’t covered in the Reports section, we can use the Explorations tool in GA4 to dive into deeper insights.
Historically, you could customize predefined reporting to an extent with Custom Reports in Universal Analytics (UA). You might have found it very difficult to find specific insights in UA if the information you were looking for wasn’t readily available in an existing report.
Explorations is a collection of advanced techniques that go beyond GA4’s standard reporting to uncover actionable insights about your user behaviour on your website and apps. We can use the Explorations tool to explore your data in depth and answer complex questions to determine the success of your business.
Here are a few advantages to using the Explorations tool in GA4:
- Quickly perform queries in real time
- Easily configure and switch between data collection techniques
- Sort and drill down deeper into the data
- Focus and filter relevant data using filters and segments
- Create segments and audiences
- Share your explorations with other GA properties
- Export exploration data for use with other tools
Explorations allow you to drag and drop different dimensions, metrics, and segments and apply a variety of techniques to interpret your data collection better. Easily filter, segment, sort, and refine your data to deliver key insights your business cares about.
How It Works
Canvas
The canvas area on the right displays your data using the selected technique from the following list:
The large area on the right displays your data using the selected technique. The canvas can have multiple tabs, letting you use multiple techniques in a single exploration. Explorations supports the following techniques:
| Technique | Description |
|---|---|
| Free-Form Exploration | In free form, you can explore data in a crosstab layout where we can apply several different visualization staples, e.g. bar charts, pie charts, scatter plots, and geo maps. |
| Cohort Exploration | Learn about insights from user behaviour and performance of groups of users related by common attributes . |
| Funnel Exploration | A visual representation of your users' steps to complete tasks on your site or app. Allows us to optimize your user experience and identify over- or under-performing audiences. |
| Segment Exploration | Learn about different user segments and how they relate to each other. This exploration technique is used to identify new segments of users who meet complex criteria. |
| User Exploration | Examine the users of specific segments that you can create or import into GA4. This allows you to drill down into individual user activities on your site or app. |
| Path Exploration | Visually represent the paths your users take as they interact with your website and app. |
| User Lifetime | Explore user behaviour and value over their lifetime as a customer. |
Variables
The left panel gives you access to all the dimensions, metrics, and segments from your GA4 account that you can use in the exploration. You can also change adjust the timeframe of the exploration at the top of the Variables panel.
Tab Settings
The options available in the Tab Settings panel are used to configure the currently selected tab in the canvas. Select the technique and add the dimensions, metrics, and segments from the Variables panel. Configure technique-specific options by dragging and dropping the different options in the Tab Settings panel.
How To Create An Exploration
The list of techniques we covered in the earlier table can be used to control the way our data is analyzed in the Explorations tool. When we select a blank exploration, the default technique is a free-form table. We can add tabs with different or more of the same techniques.
Follow these steps to create a new Exploration in GA4:
1. Navigate to the Explore tab in your GA4 property.
2. Click the + to create a new exploration or select one of the templates available.
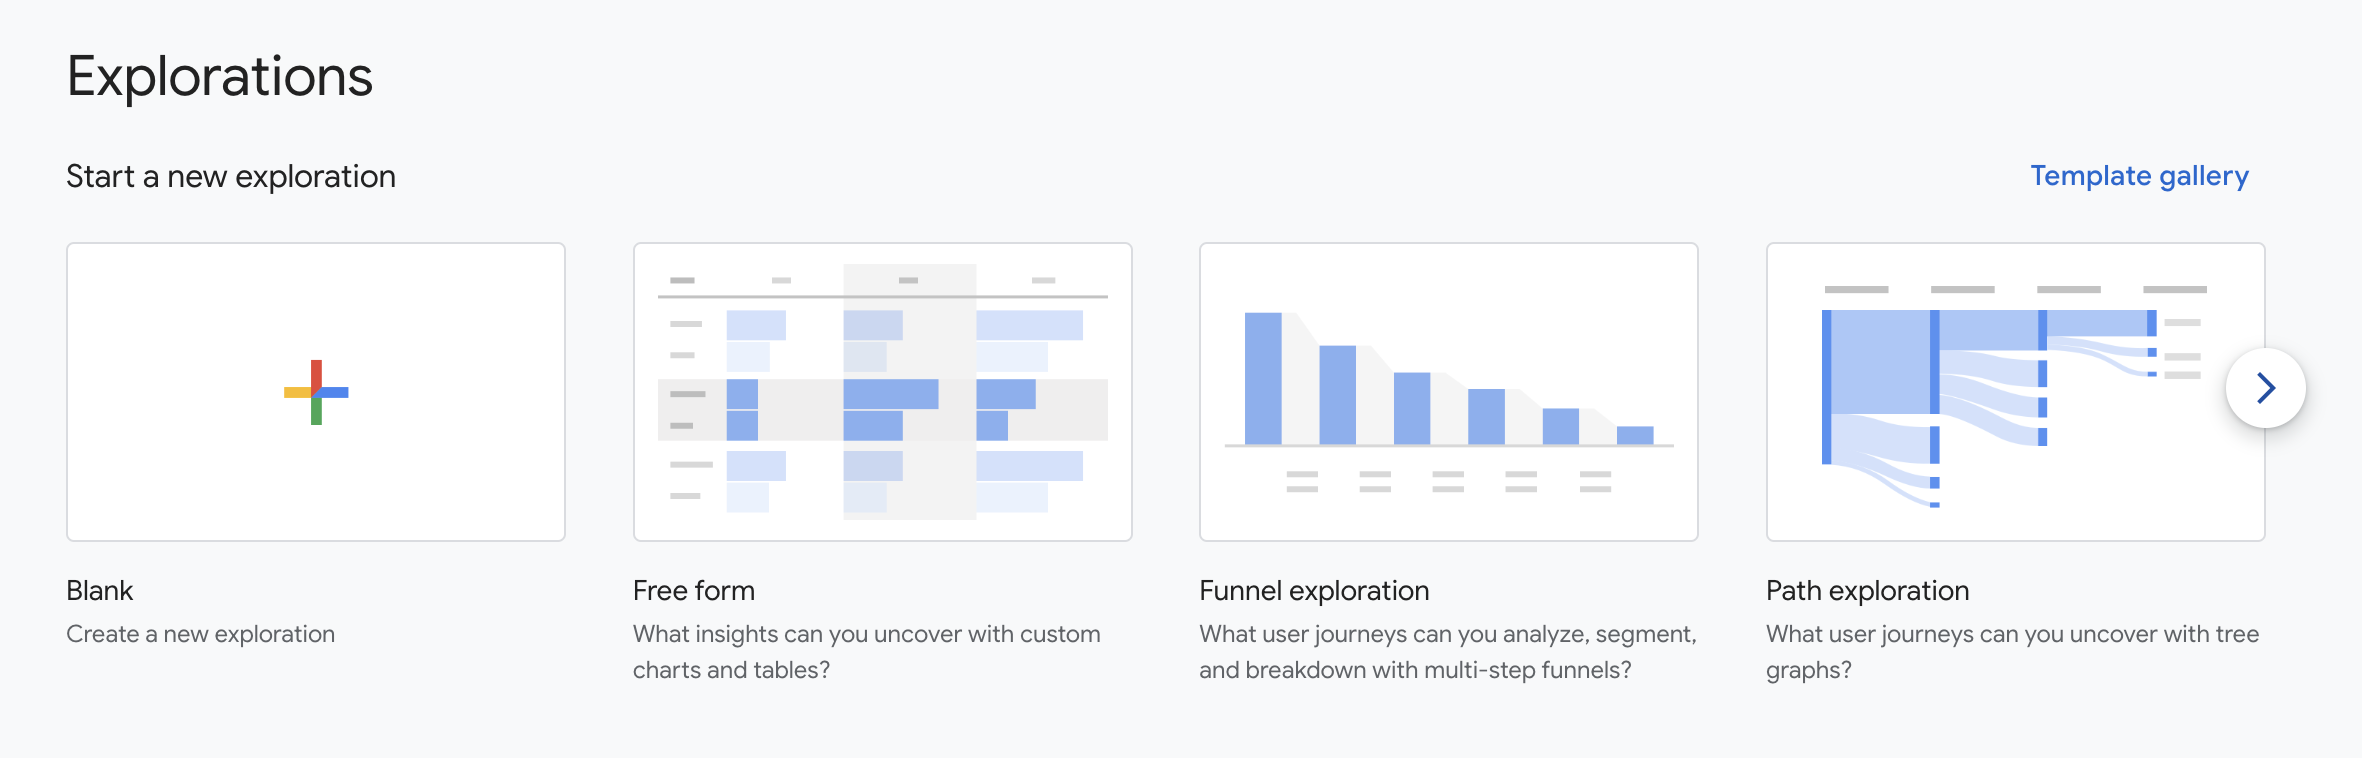
3. Select the technique you want to use to explore your data.
4. In the left Variables column, add the different Dimensions and Metrics you want to measure.
5. Drag and drop the dimensions and metrics you added to the Variables tab to fine-tune the data you see in the canvas on the right.
6. Add a segment and filters to refine your data further.
7. Export your findings.
Adding Dimensions, Metrics, And Segments To Explorations
Variables Tab
The term Variable refers to the dimensions, metrics, and segments that are included in your Google Analytics account. These can be found in the Variables and Tab Settings panels on the left. New Explorations come with a default set of variables but we can add more by following these steps:
1. In Variables, to the right of the Dimensions, Metrics, and Segments sections click +.
2. Select the items from the list you want to enable, or use the search box to find the dimension or metric you need faster.
3. Click Import.
According to Google, we can apply up to 20 dimensions and 20 metrics to any exploration.
Tab Settings
By adding variables to the Tab Settings we are able to apply the data to the technique in the current tab. There are two ways to add data to a specific technique in your Exploration:
1. Double-click a variable to apply it to the Tab Settings in a default location.
2. Drag the variable from the Variables panel to the Tab Settings.
Export And Share Your Explorations
Once you’re done creating your exploration you can share your insights with your colleagues or export the data to be used in other tools.
To share your exploration, click the Share icon in the upper right corner. This allows others to view the exploration, but not edit it, by anyone with a Viewer role to the property.
To export your exploration for other tools, click the Download icon in the upper right corner. Select your export format:
- Google Sheets
- TSV (tab separated values)
- CSV (comma separated values)
- PDF (all tabs)
After exporting your data to Sheets, TSV, or CSV formats, all the data available in the selected visualization is exported. There will be more data than is currently displayed included in your file. When you export to PDF, only the data currently displayed in the visualization will be saved.
Exploration Limitations
The Explorations tool is subject to the following limits in GA4:
- Create up to 200 individual explorations per user per property
- Create up to 500 shared explorations per property
- Apply up to 10 segments per exploration
- Apply up to 10 filters per tab
Recap
Just a reminder, on July 1, 2023 we will be saying goodbye to Google Universal Analytics. The friendly team at Fishtank are here to help your enterprise organization with your migration over to GA4. Reach out to our digital marketing team at [email protected] for all your analytics needs.
Until next time!
👋 Hey Sitecore Enthusiasts!
Sign up to our bi-weekly newsletter for a bite-sized curation of valuable insight from the Sitecore community.
What’s in it for you?
- Stay up-to-date with the latest Sitecore news
- New to Sitecore? Learn tips and tricks to help you navigate this powerful tool
- Sitecore pro? Expand your skill set and discover troubleshooting tips
- Browse open careers and opportunities
- Get a chance to be featured in upcoming editions
- Learn our secret handshake
- And more!


Meet Theresa Gutierrez
Sitecore Strategist | Sitecore Strategy MVP
⛳ 🌮👩🏻💻
Theresa, aka 'T', is a high-energy marketing creative with 8+ years of experience across various industries. She's passionate about delivering strategy and design, with a focus on Sitecore SaaS technologies. T is an avid golfer and loving dog momma, appeased only by delicious food and a bevy of something bubbly. Cheers!